Figures & data
Table 1 The primers used for qRT-PCR analysis
Figure 1 Establishment and identification of oxaliplatin-resistant (OR) HCC cell lines. (A–C) Parental HepG2, Huh7, SMMC-7721 cells, and respective OR cells, including HepG2/OXA, Huh7/OXA, and SMMC-7721/OXA, were exposed to different concentrations of OXA for 24 hrs. Then, cell viability was detected by the MTT assay. The value of controls, treated with no oxaliplatin, was set at 1.0. (D–F) Induction of cell resistance markers in OR HCC cells, assessed by Western blot for P-gp and BCRP. Data obtained by densitometry represent the mean ± SD of target protein/GAPDH band densities of three determinations for each treatment condition. OR HCC cells were cultured in cell growth medium containing 5 μg/mL, 4 μg/mL, and 8 μg/mL OXA for HepG2, Huh7, and SMMC-7721, respectively. *P<0.05, and **P<0.01 vs parental control.
Abbreviations: BCRP, breast cancer resistance protein; OXA, oxaliplatin; P-gp, p-glycoprotein; SMMC, SMMC-7721.
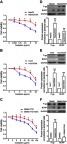
Figure 2 OR HCC cells acquire the EMT phenotype. (A–C) Morphological changes of HepG2/OXA, Huh7/OXA, and SMMC-7721/OXA cells compared with parental counterparts, as assessed by microscopy. (D) qRT-PCR was performed to assess the mRNA levels of E-cadherin and Vimentin in parental and OR HCC cells. (E–G) Left panel, Western blot was conducted to measure the protein expression levels of E-cadherin, Vimentin, Snail, and Slug in parental and OR HCC cells. Right panel, quantitative results for the left panel. (H) Huh7/OXA cells expressed low level of E-cadherin but high level of Vimentin compared with parental Huh7 cells as evidenced by immunofluorescent staining (original magnification, ×200). OR HCC cells were cultured in cell growth medium containing 5 μg/mL, 4 μg/mL, and 8 μg/mL OXA for HepG2, Huh7, and SMMC-7721, respectively. *P<0.05, and **P<0.01 vs parental control.
Abbreviations: EMT, epithelial–mesenchymal transition; HCC, hepatocellular carcinoma; OR, OXA-resistant; OXA, oxaliplatin.
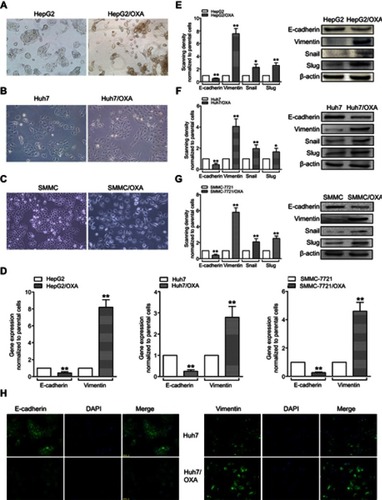
Figure 3 OR HCC cells show increased invasion and migratory abilities. (A–C) The transwell assay was performed to measure the invasive abilities of HepG2/OXA, Huh7/OXA, and SMMC-7721/OXA cells compared with parental counterparts. (D–F) The wound-healing assay was performed to compare the migratory potential of HepG2 and HepG2/OXA cells, Huh7 and Huh7/OXA cells, SMMC-7721 and SMMC-7721/OXA cells, and the distance migrated was measured. OR HCC cells were cultured in cell growth medium containing 5 μg/mL, 4 μg/mL, and 8 μg/mL OXA for HepG2, Huh7, and SMMC-7721, respectively. **P<0.01 vs parental control.
Abbreviations: HCC, hepatocellular carcinoma; OR, OXA-resistant; OXA, oxaliplatin.
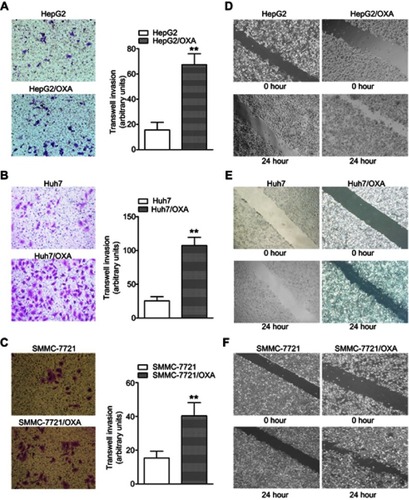
Figure 4 OR HCC cells exhibit low expression of Cx32. (A) Western blot was performed to assess protein expression levels of Cx26, Cx32, and Cx43 in parental HepG2, Huh7, SMMC-7721 cells, and OR counterpart cells. (B) Quantitative results for Cx32 protein expression. Bar graphs were derived from densitometric scanning of blots for Cx32. (C) Decreased mRNA level of Cx32 was detected in OR HCC cells compared with parental HCC cells, as shown by qRT-PCR. (D) Immunofluorescent staining revealed decreased expression of Cx32, by showing that weaker fluorescence intensities for positive signals were observed, in SMMC-7721/OXA cells compared with parental SMMC-7721 cells (original magnification, ×200). OR HCC cells were cultured in cell growth medium containing 5 μg/mL, 4 μg/mL, and 8 μg/mL OXA for HepG2, Huh7, and SMMC-7721, respectively. **P<0.01 vs parental control.
Abbreviations: Cx, connexin; HCC, hepatocellular carcinoma; OR, OXA-resistant; OXA, oxaliplatin.
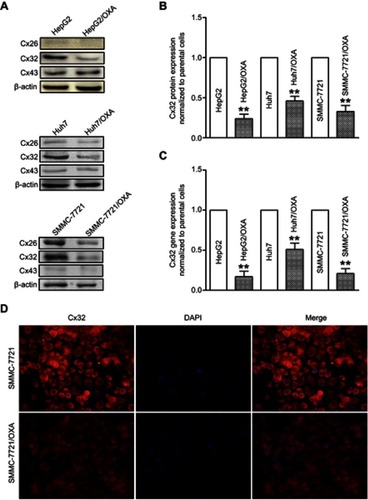
Figure 5 Depletion of Cx32 in parental Huh7 cells induces EMT and reduces chemosensitivity to OXA. (A) Western blot was conducted to detect the inhibitory effect of Cx32 siRNA in Huh7 cells. (B) Cell morphological changes of Cx32 downregulated Huh7 cells as assessed by microscopy. (C) Decreased expression of E-cadherin but increased expression levels of Vimentin and Snail were found upon Cx32 silencing in Huh7 cells, as shown by Western blot. (D) Invasive ability was enhanced by Cx32 knockdown in Huh7 cells as assessed by the transwell invasion assay. (E) The MTT assay was performed to measure cell growth in Huh7 cells transfected with Cx32 siRNA 3. **P<0.01 vs NC (D), and *P<0.05 vs either OXA treatment in Huh7 cells or OXA treatment in Huh7 cells transfected with control siRNA (E).
Abbreviations: Cx, connexin; EMT, epithelial–mesenchymal transition; NC, negative control; OXA, oxaliplatin.
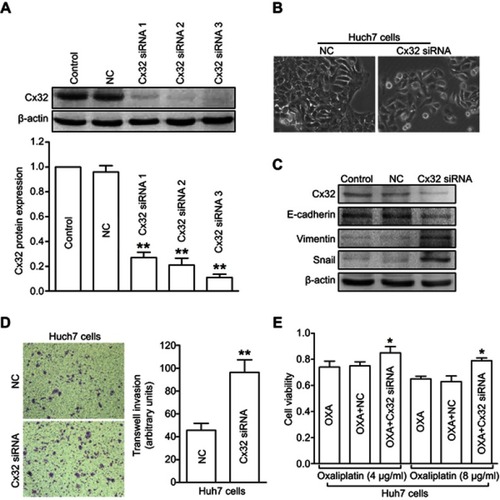
Figure 6 Overexpression of Cx32 reverses the EMT phenotype and enhances chemosensitivity to OXA in OR HCC cells. (A) Cell morphological changes of Huh7/OXA and SMMC-7721/OXA cells transfected with pEX-2/hCx32. (B) Increased expression of E-cadherin and decreased Vimentin and Snail levels were detected in Huh7/OXA and SMMC-7721/OXA cells following Cx32 overexpression, as shown by Western blot. (C) Upregulation of Cx32 suppressed cell invasion in OR HCC cells Huh7/OXA and SMMC-7721/OXA, as assessed by the transwell invasion assay. (D) Huh7/OXA and SMMC-7721/OXA showed increased chemosensitivity to OXA after Cx32 overexpression by gene transfection, as determined by the MTT assay. Huh7/OXA and SMMC-7721/OXA cells were cultured in cell growth medium containing 4 μg/mL and 8 μg/mL OXA. **P<0.01 vs NC (C), and *P<0.05 vs either OXA treatment or OXA treatment in OR cells transfected with control plasmid (D).
Abbreviations: Cx, connexin; EMT, epithelial–mesenchymal transition; NC, negative control; OE, overexpression; OR, OXA-resistant; OXA, oxaliplatin.
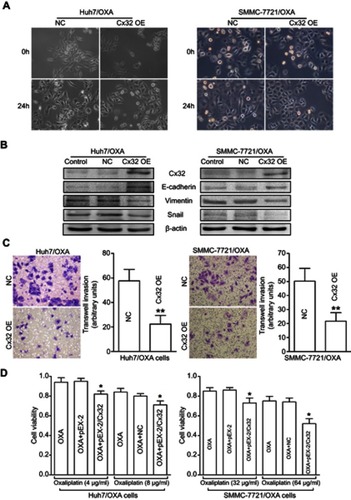
Table 2 Expression of Cx32, E-cadherin, and Vimentin in HCC and matched adjacent nontumor tissues
Table 3 Correlation of Cx32 and Vimentin expression in 34 HCCs
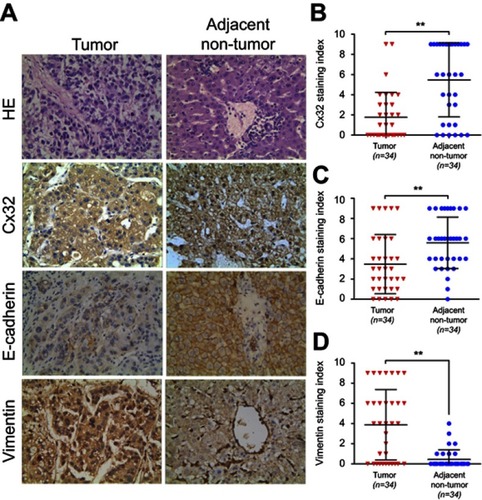
Figure 7 Expression levels of Cx32, E-cadherin and Vimentin in HCC and matched adjacent nontumor (ANT) tissues. (A) Staining of Cx32, E-cadherin, and Vimentin was performed by immunohistochemistry, and representative images are shown. While Cx32 was weakly stained and mainly located in the cytoplasm in HCC tissues, Cx32 signals were distributed abundantly and linearly on the membrane in ANT tissues. Remarkably reduced membrane staining of E-cadherin was observed in HCC tissues compared with adjacent noncancerous normal liver tissues. HCC tissues showed strong staining of Vimentin in the cytoplasm, while ANT tissues had weak or no Vimentin expression (original magnification, ×400). (B–D) The staining indexes (SI) of Cx32 (B) and E-cadherin (C) were significantly lower, but that of Vimentin (D) was markedly higher in HCC tissues compared with normal paired samples. **P<0.01.
Abbreviations: ANT, adjacent nontumor; Cx, connexin; HCC, hepatocellular carcinoma.