Figures & data
Table 1 Sequences for the RT-PCR assay
Figure 1 Determination of mRNA expression of HMGB3 in different breast cancer cells using qRT-PCR assay. (A). Statistical analysis for HMGB3 mRNA in MCF10A, MDA-MB-231 and HCC1937 cells. (B). Statistical analysis for HMGB3 mRNA in MCF10A, ZR-75-1 and MCF7 cells. (C). Statistical analysis for HMGB3 in all of the normal cells and breast cancer cells. *p<0.05, **p<0.01 vs MCF10A cells.
Abbreviation: HMGB3, High-mobility group box 3.
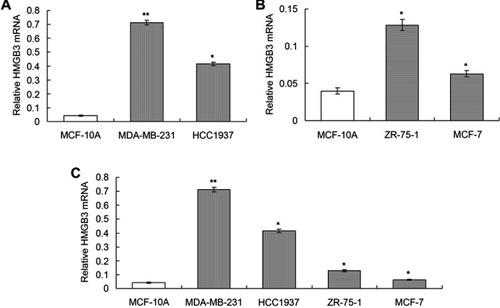
Figure 2 Effects of HMGB3 overexpression on MCF10A proliferation and HMGB3 silence on MDA-MB-231 proliferation. (A). Statistical analysis for HMGB3 mRNA in HMGB3-treated MCF10A cells. (B). Statistical analysis for HMGB3 mRNA in siHMGB3-treated MDA-MB-231 cells. (C). Effects of HMGB3 overexpression on MCF10A proliferation at 24 hrs, 48 hrs and 72 hrs. (D) Effects of HMGB3 silence on MDA-MB-231 proliferation at 24 hrs, 48 hrs and 72 hrs. *p<0.05 vs MCF10A-LV5 cells or MDA-MB-231-LV3 cells.
Abbreviation: HMGB3, High-mobility group box 3.
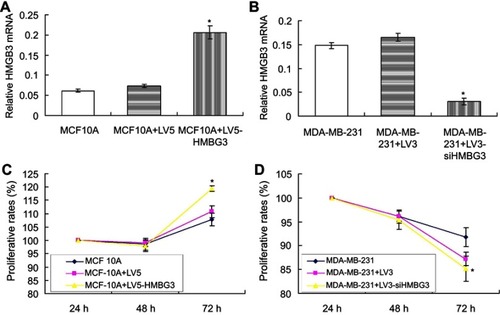
Figure 3 Mammosphere formation in the HMGB3-treated MCF10A cells and siHMGB3-treated MDA-MB-231 cells. (A). Images and statistical analysis for mammosphere formation in HMGB3-treated MCF10A cells. Scale bar: 100×. (B). Images and statistical analysis for mammosphere formation in siHMGB3-treated MDA-MB-231 cells. *p<0.05 vs MCF10A-LV5 cells or MDA-MB-231-LV3 cells.
Abbreviation: HMGB3, High-mobility group box 3.
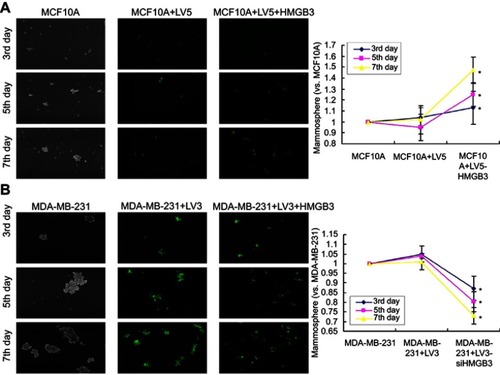
Figure 4 Evaluation of Nanog, Sox2 and OCT-4 mRNA and protein expression using qRT-PCR and western blot assay. (A). Statistical analysis for the Nanog, Sox2 and OCT-4 mRNA expression in HMGB3-treated MCF10A and siHMGB3-treated MDA-MB-231 cells using qRT-PCR assay. (B). Statistical analysis for the Nanog, Sox2 and OCT-4 expression in HMGB3-treated MCF10A and siHMGB3-treated MDA-MB-231 cells using western blot assay. *p<0.05 vs MCF10A-LV5 cells or MDA-MB-231-LV3 cells. The number 1–6 represent the MCF10A, MCF10A+LV5, MCF10A+LV5+HMGB3, MDA-MB-231, MDA-MB-231+LV3 and MDA-MB-231+LV3-siHMGB3, respectively.
Abbreviation: HMGB3, High-mobility group box 3.
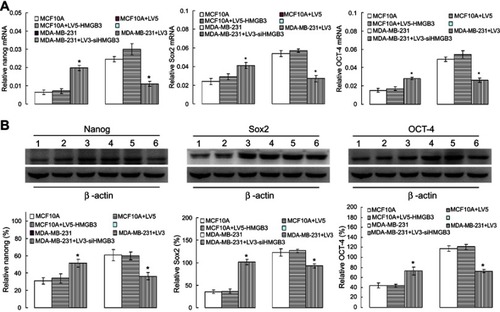
Figure 5 CD44+/CD24– levels detection in MCF10A and MDA-MB-231 cells with flow cytometry assay. (A). CD44+/CD24– evaluation in HMGB3-treated MCF10A cells. (B). CD44+/CD24– evaluation in siHMGB3-treated MDA-MB-231 cells. *p<0.05 vs MCF10A-LV5 cells or MDA-MB-231-LV3 cells.
Abbreviation: HMGB3, High-mobility group box 3.
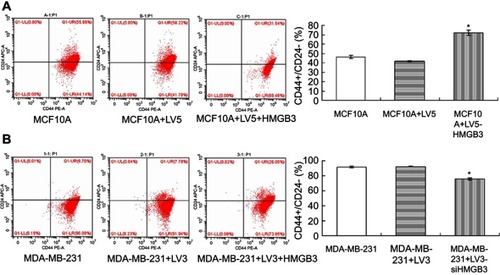
Figure 6 Tumor size calculation of the PTX and/or siHMGB3-treated xenograft tumor mice models. (A). Xenograft tumor mice models with tumors and the isolated tumors. (B). Statistical analysis for the tumor sizes. *p<0.05 vs MDA-MB-231 cells. #p<0.05 vs PTX group.
Abbreviation: HMGB3, High-mobility group box 3.
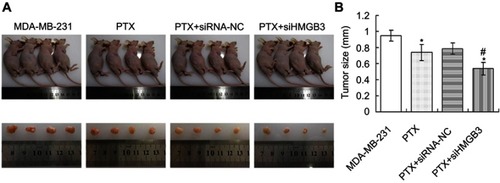
Figure 7 Examination for the Nanog, Sox2 and OCT-4 expression and mammosphere formation evaluation in tumor tissues of xenograft tumor mice models. (A). Nanog, Sox2 and OCT-4 expression was examined with immunofluorescence assay. Scale bar: 400×. (B). Mammosphere formation evaluation in tumor tissues. *p<0.05 vs MDA-MB-231 cells. #p<0.05 vs PTX group.
Abbreviation: HMGB3, High-mobility group box 3.
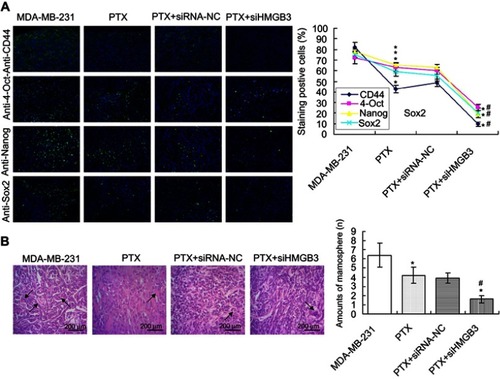
Figure 8 HIF1α examination in the HMGB3-treated MCF10A cells and siHMGB3-treated MDA-MB-231 cells. (A). Statistical analysis for HMGB3 mRNA expression. (B). Statistical analysis for the HMGB3 expression. *p<0.05 vs MCF10A cells or MDA-MB-231 cells.
Abbreviation: HMGB3, High-mobility group box 3.
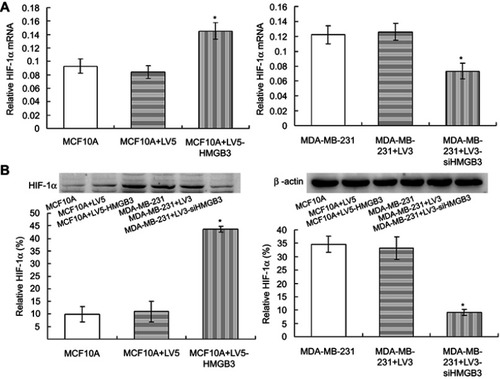
Figure 9 Mammosphere formation in HMGB3/siHIF1α-treated MCF10A cells and siHMGB3/HIF1α-treated MDA-MB-231 cells. (A). Images for the mammosphere formation. (B). Statistical analysis for mammosphere formation in HMGB3/siHIF1α-treated MCF10A cells. (C). Statistical analysis for mammosphere formation in siHMGB3/HIF1α-treated MDA-MB-231 cells. *p<0.05 vs MCF10A cells or MDA-MB-231 cells.
Abbreviation: HMGB3, High-mobility group box 3.
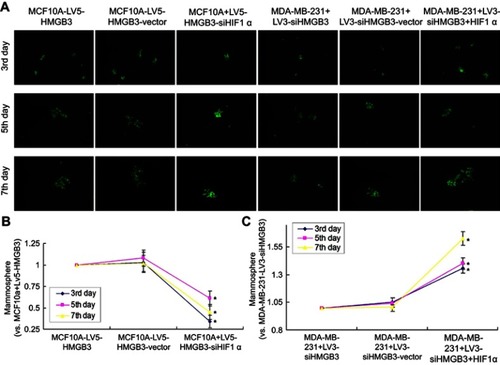
Figure 10 Determination for CD44+/CD24– levels in HMGB3/siHIF1α-treated MCF10A cells and siHMGB3/HIF1α-treated MDA-MB-231 cells using flow cytometry assay. (A). CD44+/CD24– evaluation in HMGB3/siHIF1α-treated MCF10A cells. (B). CD44+/CD24– evaluation in siHMGB3/HIF1α-treated MDA-MB-231 cells. *p<0.05 vs MCF10A cells or MDA-MB-231 cells.
Abbreviation: HMGB3, High-mobility group box 3.
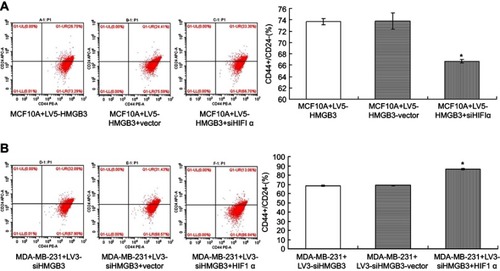
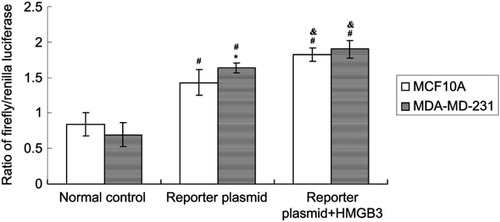
Figure 11 Interaction analysis between HIF1α and HMGB3 expression in MCF10A and MDA-MB-231 cells. *p<0.05 vs MCF10A cells. #p<0.05 vs Normal control group for both MCF10A and MDA-MD-231 cells. &p<0.05 vs single transfected MCF10A or MDA-MB-231 cells.
Abbreviation: HMGB3, High-mobility group box 3.