
Figures & data
Figure 1 Flow diagram of literature search process. PubMed database was comprehensively searched for potentially relevant studies through January 2019. A total of 156 potentially eligible studies were identified and 12 eligible studies were finally included in this meta-analysis.
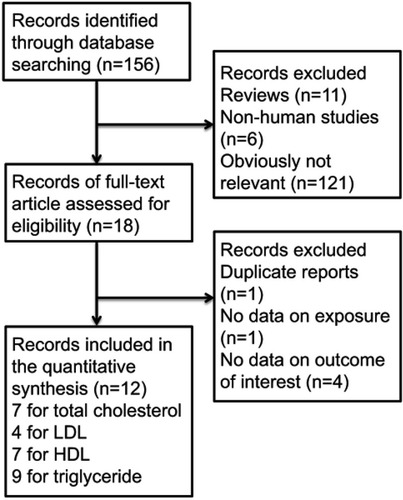
Table 1 Main characteristics of the included studies
Figure 2 A forest plot of hazard ratio for total cholesterol, which was reported in 7 studies (8 data sets).
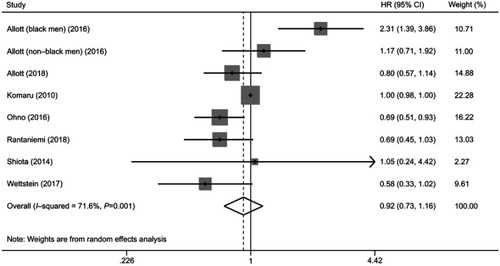
Figure 3 A forest plot of hazard ratio for low-density lipoprotein (LDL), which was reported in 4 studies (5 data sets).
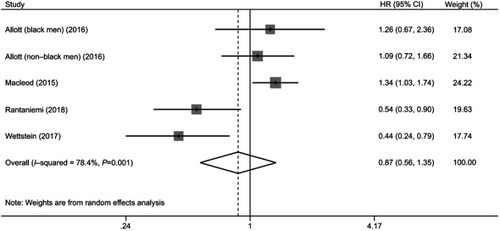
Figure 4 A forest plot of hazard ratio for high-density lipoprotein (HDL), which was reported in 7 studies (8 data sets).
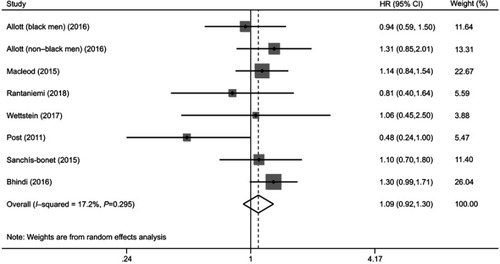
Figure 5 A forest plot of hazard ratio for triglyceride, which was reported in 9 studies (10 data sets).
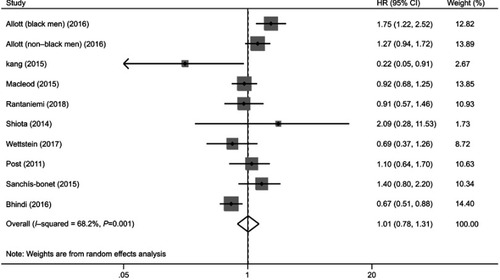
Table 2 Subgroup analyses stratified by study design and region
Table 3 P-values of Begg’s test and Egger’s test
Figure 6 Sensitivity analysis was conducted by excluding each study sequentially and then repeating the meta-analysis to determine the influence of a single study.
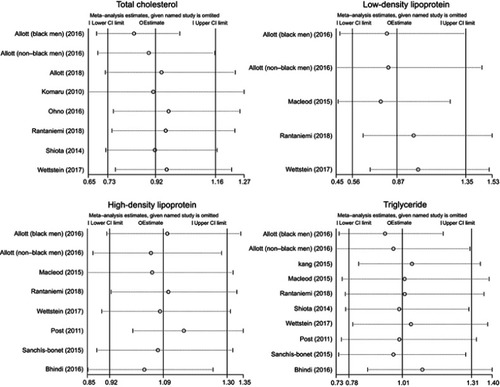
Figure 7 Begg’s funnel plots for publication bias. If publication bias is present, the plot will be asymmetrical.
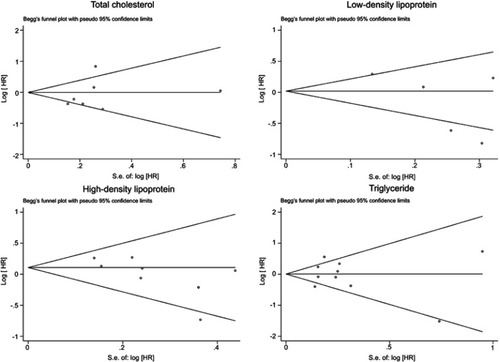
Table S1 Newcastle–Ottawa Scale scores of each included study
Table S2 Subgroup analyses stratified by duration of follow-up, No. of patients, and NOS score