Figures & data
Figure 1 The expression of DYNLT3 protein in different ovarian epithelial lesions. (A) Image of staining with DYNLT3 in normal ovarian epithelial tissue (×100). (B) Image of staining with DYNLT3 in normal ovarian epithelial tissue (×400). (C) Image of staining with DYNLT3 in ovarian serous cystadenoma tissue (×100). (D) Image of staining with DYNLT3 in ovarian serous cystadenoma tissue (×400). (E) Image of staining with DYNLT3 in ovarian serous cystadenocarcinoma tissue (×100). (F) Image of staining with DYNLT3 in ovarian serous cystadenocarcinoma tissue (×400).
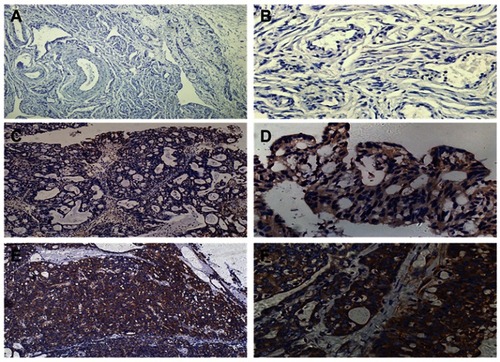
Figure 2 The prognostic value of DYNLT3 expression in www.kmplot.com. (A) overall survival curve is plotted for all ovarian cancer patients. (B) overall survival curve is plotted for serous ovarian cancer patients. (C) overall survival curve is plotted for endometrioid ovarian cancer patients. (D) progression free survival curve is plotted for all ovarian cancer patients. (E) progression free survival curve is plotted for serous ovarian cancer patients. (F) progression free survival curve is plotted for endometrioid ovarian cancer patients.
Abbreviations: OS, overall survival; PFS, progression free survival.
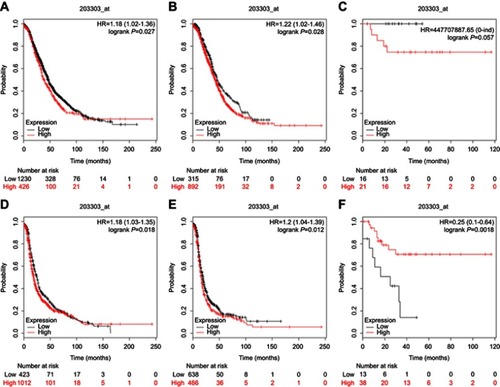
Figure 3 The expression of DYNLT3 mRNA and protein. (A) The expression of DYNLT3 mRNA in IOSE80 and SKOV3 was detected by qRT-PCR. (B) The expression of DYNLT3 protein in IOSE80 and SKOV3 was detected by Western blot. (C) DYNLT3 protein expression in SKOV3 cells transduced with DYNLT3-pLVX-IRES-ZsGreen1 lentivirus. (D) DYNLT3 protein expression in SKOV3 cells transduced with TRC2-pLKO-puro-shDYNLT3 lentivirus. Data are expressed as mean ± standard deviation from triplicate experiments (*P<0.05).
Abbreviations: BC-OE, over-expression blank control group; NC-OE, over-expression vector control group; OE-DYNLT3, DYNLT3-overexpression group; BC-KD, knock-down blank control group; NC-KD, knock-down vector control group; KD-DYNLT3, DYNLT3-knock-down group.
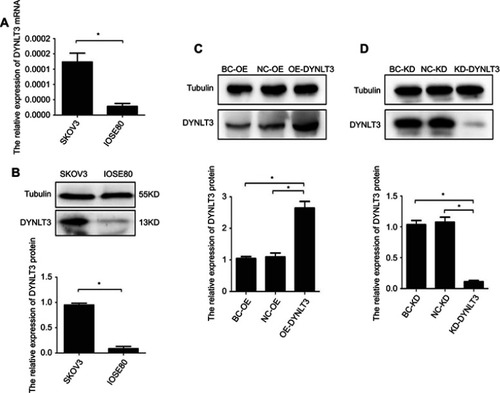
Figure 4 The effect of DYNLT3 on the proliferation and apoptosis of ovarian cancer cell. (A) The effect of DYNLT3 on the proliferation of SKOV3 cells. (B) The effect of DYNLT3 on the apoptosis of SKOV3 cells. Data are expressed as mean ± standard deviation from triplicate experiments (*P<0.05).
Abbreviations: BC-OE, over-expression blank control group; NC-OE, over-expression vector control group; OE-DYNLT3, DYNLT3-overexpression group; BC-KD, knock-down blank control group; NC-KD, knock-down vector control group; KD-DYNLT3, DYNLT3-knock-down group.
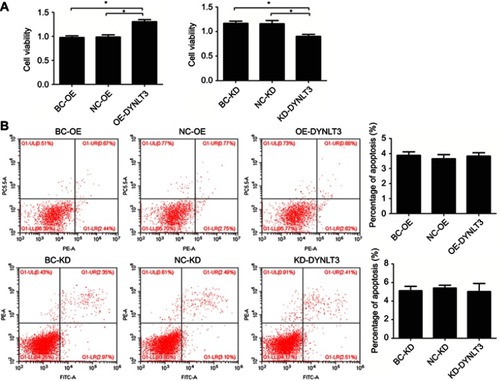
Figure 5 The effect of DYNLT3 on ovarian cancer cell migration and invasion. (A) Cell migration was evaluated by Wound Healing method (×100). (B) Cell invasion was evaluated by transwell invasion assay (×100). Data are expressed as mean ± standard deviation from triplicate experiments (*P<0.05).
Abbreviations: BC-OE, over-expression blank control group; NC-OE, over-expression vector control group; OE-DYNLT3, DYNLT3-overexpression group; BC-KD, knock-down blank control group; NC-KD, knock-down vector control group; KD-DYNLT3, DYNLT3-knock-down group.
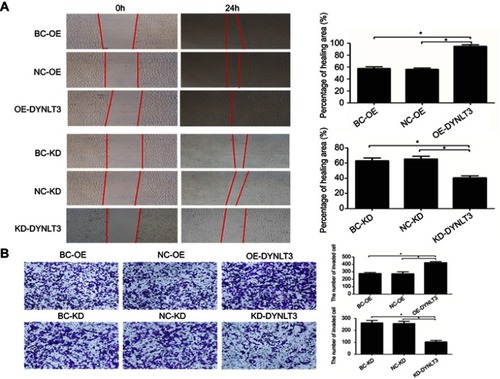
Figure 6 The expression of proliferation-related protein Ki-67 and PCNA in SKOV3 cells after transfected with DYNLT3-pLVX-IRES-ZsGreen1 and TRC2-pLKO-puro-shDYNLT3 lentivirus (×40). (A) The relative expression level of Ki-67 protein. (B) The relative expression level of PCNA protein. Data are expressed as mean ± standard deviation from triplicate experiments (*P<0.05).
Abbreviations: BC-OE, over-expression blank control group; NC-OE, over-expression vector control group; OE-DYNLT3, DYNLT3-overexpression group; BC-KD, knock-down blank control group; NC-KD, knock-down vector control group; KD-DYNLT3, DYNLT3-knock-down group.
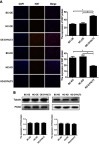
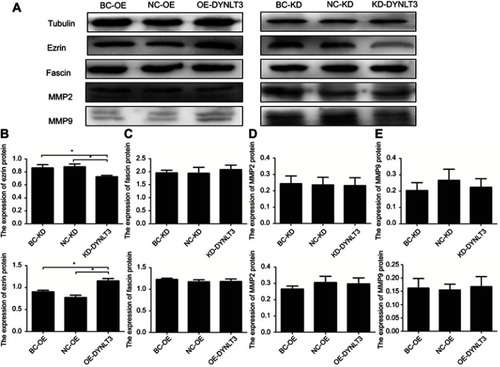
Figure 7 The expression of migration/invasion-related protein Ezrin, Fascin, MMP2 and MMP9 in SKOV3 cells after transfected with DYNLT3-pLVX-IRES-ZsGreen1 and TRC2-pLKO-puro-shDYNLT3 lentivirus. (A) Image of Western blot. (B) The relative expression level of Ezrin protein. (C) The relative expression level of Fascin protein. (D) The relative expression level of MMP2 protein. (E) The relative expression level of MMP9 protein. Data are expressed as mean ± standard deviation from triplicate experiments (*P<0.05).
Abbreviations: BC-OE, over-expression blank control group; NC-OE, over-expression vector control group; OE-DYNLT3, DYNLT3-overexpression group; BC-KD, knock-down blank control group; NC-KD, knock-down vector control group; KD-DYNLT3, DYNLT3-knock-down group.