149
Views
18
CrossRef citations to date
0
Altmetric
Original Research

Intensity-modulated carbon-ion radiation therapy versus intensity-modulated photon-based radiation therapy in locally recurrent nasopharyngeal carcinoma: a dosimetric comparison

, , , , &
Pages 7767-7777 | Published online: 16 Aug 2019

Figures & data

Figure 1 Organs at risk (OARs) contoured on planning computed tomography (CT) with magnetic resonance imaging (MRI) fusion. (A) Brain stem contoured on CT with MRI image fusion; (B) spinal cord contoured on CT with MRI image fusion; (C) eyeball, optic chiasm and temporal lobe contoured on CT with MRI image fusion; (D) lens and optic never contoured on CT with MRI image fusion; (E) parotid gland contoured on CT with MRI image fusion; and (F) temporomandibular joint and inner ear contoured on CT with MRI image fusion.

Figure 1 Organs at risk (OARs) contoured on planning computed tomography (CT) with magnetic resonance imaging (MRI) fusion. (A) Brain stem contoured on CT with MRI image fusion; (B) spinal cord contoured on CT with MRI image fusion; (C) eyeball, optic chiasm and temporal lobe contoured on CT with MRI image fusion; (D) lens and optic never contoured on CT with MRI image fusion; (E) parotid gland contoured on CT with MRI image fusion; and (F) temporomandibular joint and inner ear contoured on CT with MRI image fusion.

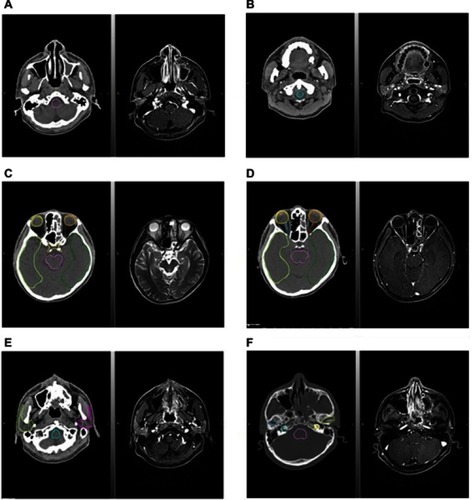
Table 1 Patient characteristics

Figure 2 Dose distribution of intensity-modulated carbon-ion-based radiation therapy (IMCT) and intensity-modulated photon-based radiation therapy (IMRT) planning in one patient which demonstrates a typical comparison of the dose distribution by IMCT and IMRT planning in transverse, coronal, and sagittal sections.

Figure 2 Dose distribution of intensity-modulated carbon-ion-based radiation therapy (IMCT) and intensity-modulated photon-based radiation therapy (IMRT) planning in one patient which demonstrates a typical comparison of the dose distribution by IMCT and IMRT planning in transverse, coronal, and sagittal sections.

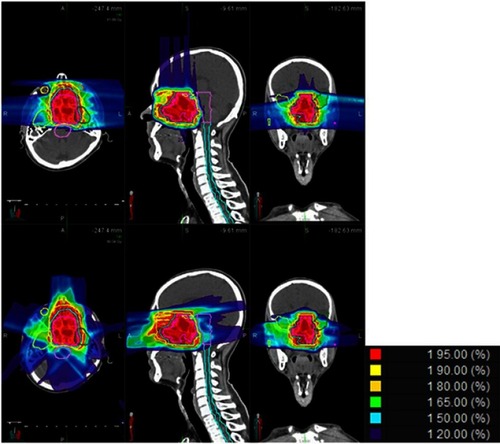
Table 2 Dosimetric summary, CI and HI of target volumes

Figure 3 Cumulative dose-volume histograms for clinical target volume (CTV) and organs at risk (OARs) for the same representative patient. The solid line is intensity-modulated carbon ion radiation therapy (IMCT) plan and the dotted line is intensity-modulated radiation therapy (IMRT) plan. (A) Cumulative dose-volume histograms (DVH) for CTV for the same representative patient; (B) cumulative DVH for brain stem and spinal cord for the same representative patient; (C) cumulative DVH for lens and eyeball for the same representative patient; (D) cumulative DVH for optic nerve and chiasm for the same representative patient; (E) cumulative DVH for parotid gland for the same representative patient; (F) cumulative DVH for temporal lobe for the same representative patient; and (G) cumulative DVH for temporomandibular joint and inner ear for the same representative patient.

Figure 3 Cumulative dose-volume histograms for clinical target volume (CTV) and organs at risk (OARs) for the same representative patient. The solid line is intensity-modulated carbon ion radiation therapy (IMCT) plan and the dotted line is intensity-modulated radiation therapy (IMRT) plan. (A) Cumulative dose-volume histograms (DVH) for CTV for the same representative patient; (B) cumulative DVH for brain stem and spinal cord for the same representative patient; (C) cumulative DVH for lens and eyeball for the same representative patient; (D) cumulative DVH for optic nerve and chiasm for the same representative patient; (E) cumulative DVH for parotid gland for the same representative patient; (F) cumulative DVH for temporal lobe for the same representative patient; and (G) cumulative DVH for temporomandibular joint and inner ear for the same representative patient.

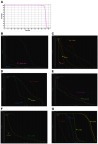
Table 3 Dosimetric comparison of OARs between treated IMCT plans and reference IMRT plans