Figures & data
Figure 1 Flow diagram of study selection process.
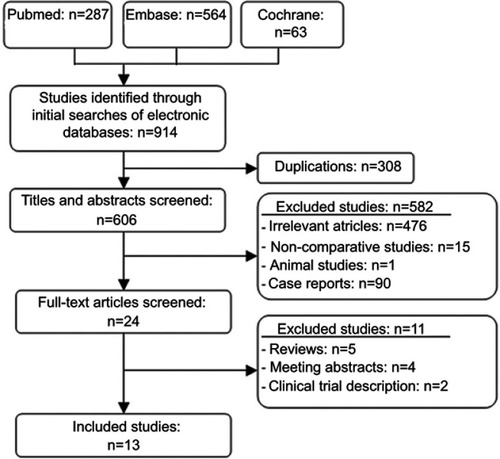
Table 1 Characteristics of included studies
Table 2 Risk of bias of included randomized controlled trials based on Cochrane Handbook for Systematic Reviews of Interventions
Table 3 Risk of bias for included non-randomized studies based on Newcastle-Ottawa scale
Figure 2 Forest plot and meta-analysis of total complication events.
Abbreviation: M-H, Mantel-Haenszel method.
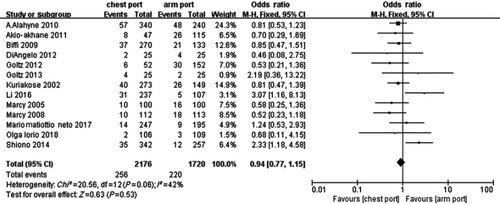
Figure 3 Forest plot and meta-analysis of primary outcomes.
Abbreviation: M-H, Mantel-Haenszel method.
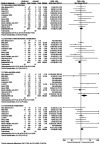
Figure 4 Forest plot and meta-analysis of secondary outcomes. (A) Comparison of procedure conversion rate and early port removal. (B) Comparison of operating time between groups.
Abbreviations: M-H, Mantel-Haenszel method; IV, inverse variance method.
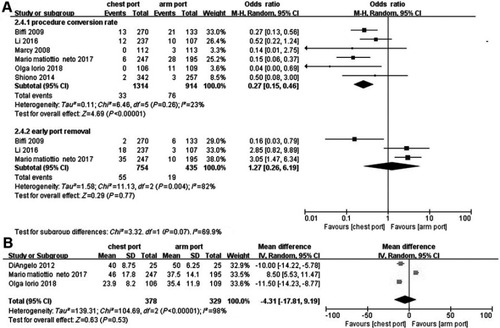
Table 4 Subgroup analysis comparing chest ports and arm ports
Table 5 Sensitivity analysis comparing chest ports and arm ports
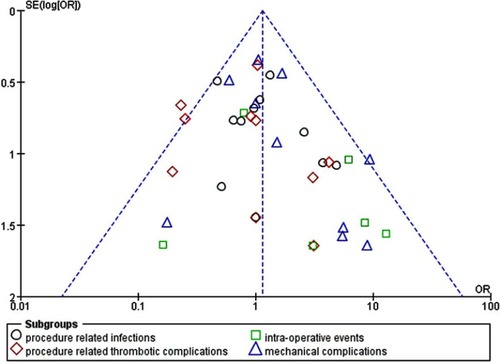
Figure 5 Funnel plot demonstrating meta-analysis of primary outcomes of interest.
Abbreviation: SE, standard error.