
Figures & data
Table 1 Patient characteristicsa
Table 2 Postoperative outcomesa
Figure 1 Overall, minor and major morbidity rates between 3 SIS groups.
Abbreviation: SIS, systemic inflammation score.
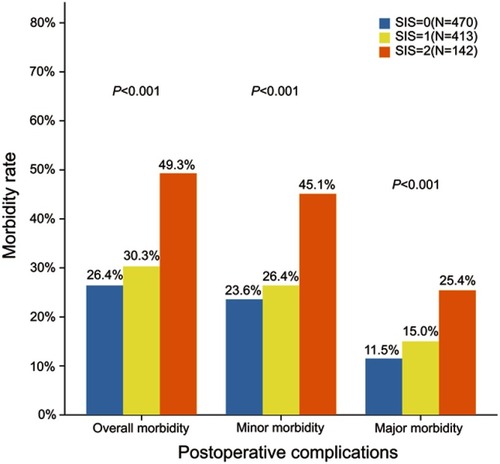
Figure 2 Incidences of five most frequent complications between 3 SIS groups.
Abbreviation: SIS, systemic inflammation score.
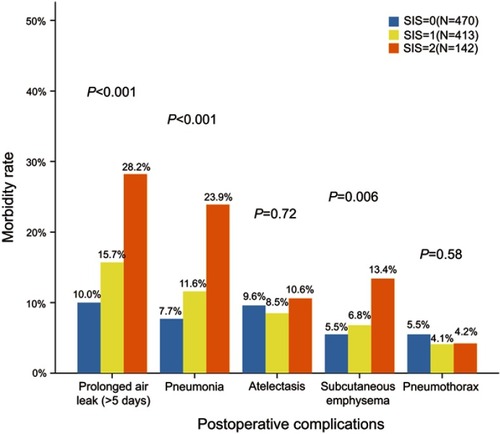
Table 3 Univariable analysis of predictors for overall morbidity
Table 4 Multivariable analysis of predictors for overall morbidity
Figure 3 C-statistic revealing discriminative power of multivariable logistic-regression model for the prediction of overall morbidity.
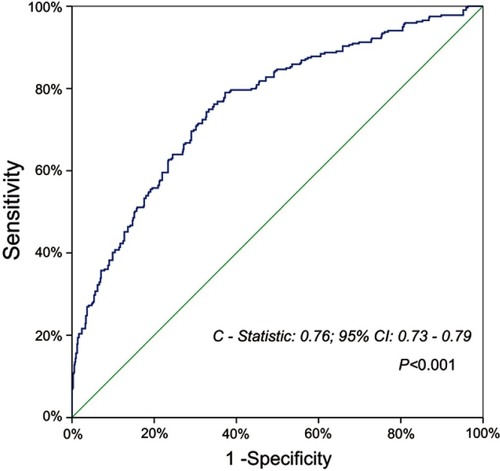
Table S1 Multivariable analysis of predictors for minor morbidity (Clavien-Dindo Grade II complications)a
Table S2 Multivariable analysis of predictors for major morbidity (Clavien-Dindo Grade ≥III complications)a