
Figures & data
Figure 1 Up-regulated Linc00460 in breast cancer tissues, predicts poorer prognosis. (A) qRT-PCR analysis of Linc00460 expression in two normal mammary epithelial cell lines and six breast cancer cell lines. Data are presented as mean ± SD and analyzed using independent samples t-test. **P<0.01. (B) qRT-PCR analysis of Linc00460 expression in 42 breast cancer tissues and 15 benign breast tissues. Data were shown as 2−ΔCt and presented as the median with a range, *P<0.05. (C) qRT-PCR analysis of Linc00460 expression in 21 breast cancer tissues with lymphatic node metastasis and 20 lymphatic node metastasis-free breast cancer tissues. Data were shown as 2−ΔCt and presented as median with a range, *P<0.05. (D) Expression levels of Linc00460 were analyzed in breast cancer tissues and normal breast tissues in TCGA BRCA cohorts. **P<0.01 (E) Expression levels of Linc00460 were analyzed in 59 breast cancer tissues with lymphatic node metastasis and 29 lymphatic node metastasis free-breast cancer tissues in GSE20711. *P<0.05 (F) Kaplan–Meier’s analysis of the correlation between Linc00460 expression and the overall survival of 42 breast cancer patients.
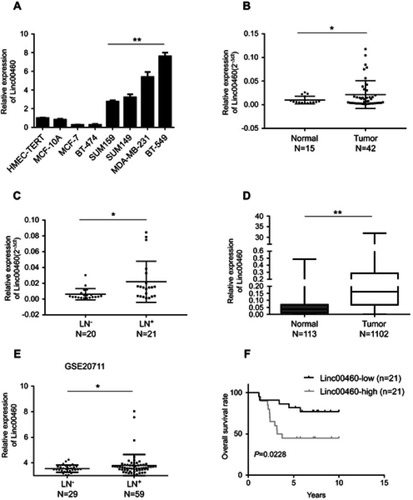
Table 1 Correlation of Linc00460 expression with clinicopathological features in 42 breast cancer patients
Table 2 Univariate and multivariate Cox proportional hazards regression analysis of Linc00460 for overall survival in breast cancer patients
Figure 2 Forced expression of Linc00460 promotes proliferation and metastasis of breast cancer cells both in vitro and in vivo. (A) Expression levels of Linc00460 were determined by qRT-PCR in MCF-7 and MDA-MB-231 cells stably transfected with Linc00460 shRNAs (460-sh1 and 460-sh2) or empty vector (Ctr). (B) Expression levels of Linc00460 were determined by qRT-PCR in MCF-7 and MDA-MB-231 cells stably transfected with pSin plasmid containing Linc00460 (pSin-460oe) or the empty vector (pSin-vec). (C and E) Cell viabilities of the respective stably transfected MCF-7 and MDA-MB-231 cells were determined by MTT assay over a period of 5 days. (D and F) Colony formation of the stably transfected MCF-7 and MDA-MB-231 cells was determined over a period of 10 days. (G–J) Transwell assays of the stably transfected MCF-7 and MDA-MB-231 cells. Representative pictures were taken at 100× magnification, and the total number of cells on the bottom surface of transwell were counted and presented as the relative fold changes. In all panels of this figure, the statistical differences were all analyzed using independent samples t-test. (K-L) Growth of MCF-7-vec or MCF-7-Linc00460 cells-derived tumors in the orthotopic xenograft models (N=6). Data are presented as mean ± SEM and analyzed using two-way ANOVA. *P<0.05. (M) H&E staining of respective MCF-7-vec or MCF-7-Linc00460 cells-derived tumors. Arrow indicates fat pad invasion of MCF-7-Linc00460 cells-derived tumors. Images were taken at 100× magnification. (N) H&E staining of lung sections of mice with tail vein injections of MDA-MB-231 cells stably transfected with either Linc00460 shRNAs (460-sh1 and 460-sh2) or empty vector (Ctr). The metastatic nodules were indicated by white arrow. Images were taken at 200× magnification. (O) Incidence of lung metastasis in mice of tail vein injection model. χ2 test, **P<0.01.
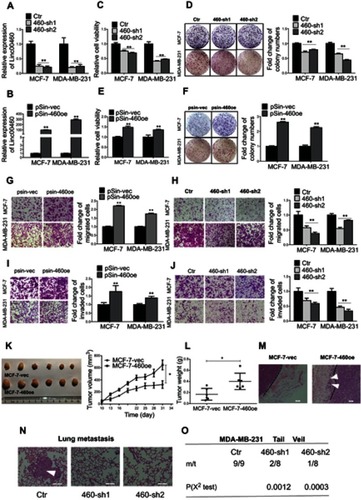
Figure 3 Linc00460 is a direct target of miR-489-5p. (A) The schema showing the screening process for potential miRNAs that bind Linc00460. (B–C) Expression levels of miR-489-5p in MCF-7 and MDA-MB-231 cells, stably transfected with Linc00460 shRNAs (460-sh1 and 460-sh2), Linc00460-expressing plasmid (pSin-460oe) or their respective empty vectors (Ctr, pSin-vec). Data are presented as mean ± SD, analyzed using independent samples t-test. *P<0.05; **P<0.01. (D) Predicted miR-489-5p-binding site in Linc00460 and sequence of the mutated miR-489-5p-binding site used. (E) Luciferase reporter plasmids containing wild type Linc00460, mutant Linc00460, or empty luciferase reporter plasmid, were co-transfected with miR-489-5p mimics or scrambled oligonucleotides negative control into MCF-7 cells and MDA-MB-231 cells. Firefly luciferase reporter activities determined were normalized with Renilla luciferase reporter activities. Data are presented as the mean ± SD, analyzed using independent samples t-test. *P<0.05. (F) Enrichment of Linc00460 and miR-489-5p in biotin-labeled anti-Linc00460 probes pull-down RNA fraction of MCF-7 cells was determined by qRT-PCR. Data are presented as mean ± SD, analyzed using independent samples t-test. *P<0.05; **P<0.01. (G) Pearson’s correlation was performed to analyze the correlations between the expression levels of Linc00460 and miR-489-5p in 42 breast cancer tissues. Data were shown as ΔCt (R= -0.3527, P<0.05). (H) qRT-PCR analysis of miR-489-5p expression in 42 breast cancer tissues and 15 non-tumorous breast tissues. Data were shown as 2−ΔCt and presented as median with a range, *P<0.05. (Student’s t-test).
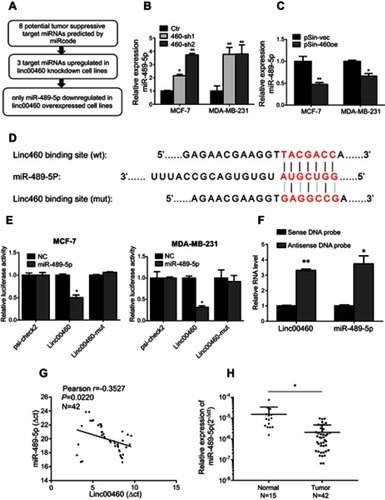
Figure 4 MiR-489-5p inhibits breast cancer cell proliferation, migration and invasion. (A) Expression levels of miR-489-5p were determined by qRT-PCR in MCF-7 and MDA-MB-231 cells transfected with miR-489-5p mimics or negative control scrambled oligonucleotides (NC). (B) Expression levels of miR-489-5p were determined by qRT-PCR in MCF-7 and MDA-MB-231 cells transfected with miR-489-5p inhibitor or negative control scrambled oligonucleotides (NC inhibitor). (C–D) Cell viabilities of respective transfected MCF-7 and MDA-MB-231 cells were determined by MTT assay 5 days post-seeding. (E-F) Colony formation of transfected MCF-7 and MDA-MB-231 cells over a period of 10 days was determined. (G–J) Migration and invasion of transfected MCF-7 and MDA-MB-231 cells were determined by transwell assay. All data are present as mean ± SD from three independent experiments. *P<0.05; **P<0.01 (Student’s t-test).
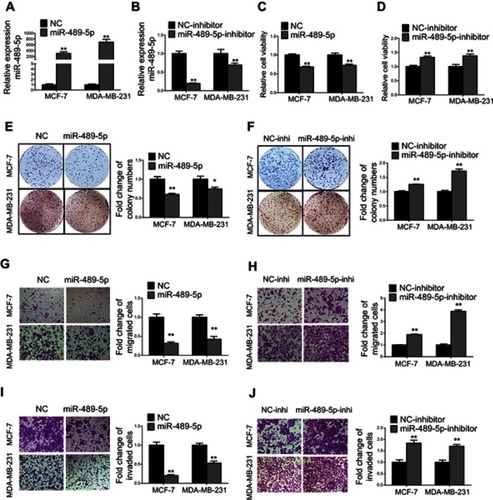
Figure 5 Linc00460 competitively binds to miR-489-5p to increase FGF7 expression and activates downstream AKT signaling. (A) Predicted miR-489-5p-binding site on the 3ʹUTR of FGF7 mRNA. (B-C) Luciferase reporter plasmids containing FGF-7 3ʹUTR or empty control were co-transfected with miR-489-5p mimics, miR-489-5p inhibitors, or their respective scrambled oligonucleotide control into MCF-7 cells and MDA-MB-231 cells. Firefly luciferase reporter activities determined were normalized with Renilla luciferase reporter activities. Data are presented as mean ± SD, analyzed using independent samples t-test. *P<0.05. (D–E) Protein and mRNA levels of FGF7 in MCF-7 and MDA-MB-231 cells transfected miR-489-5p mimics, miR-489-5p inhibitor, or their respective scrambled oligonucleotide control, were analyzed by Western blot and qRT-PCR, respectively. Data are presented as mean ± SD, analyzed using independent samples t-test. *P<0.05. (F–G) Expression levels of FGF7 in MCF-7 and MDA-MB-231 cells transfected with the Linc00460-expressing plasmid, Linc00460 shRNAs or respective empty vectors were determined by qRT-PCR. Data are presented as mean ± SD, analyzed using independent samples t-test. **P<0.01. (H–I) Protein levels of FGF7, and phosphorylated and total-AKT in MCF-7 and MDA-MB-231 cells stably transfected with Linc00460-expressing plasmid, Linc00460 shRNAs or respective empty vectors were determined by Western blot. (J) Pearson’s correlation was performed to analyze the correlations between the levels of Linc00460 and FGF7 in 87 breast cancer tissues from GSE6532 dataset (R=0.3261, P<0.05). (K) AGO2 protein levels of co-immunoprecipitated products were measured by Western blot in MCF-7-pSin-460oe cells or –vector cells. (L–M) RIP-qRT-PCR assays were used to examine the FGF7 and miR-489-5p levels in associated with AGO2 upon Linc00460 overexpression in MCF-7 cells. Data are present as mean ± SD from three independent experiments. *P<0.05; **P<0.01 (Student’s t-test). (N) AGO2 protein levels of co-immunoprecipitated products were measured by Western blot in MDA-MB-231-pSin-460oe cells or –vector cells. (O–P) RIP-qRT-PCR assays were used to examine FGF7 and miR-489-5p levels in associated with AGO2 after Linc00460 overexpression in MDA-MB-231 cells. Data are present as mean ± SD from three independent experiments. *P<0.05; **P<0.01 (Student’s t-test).
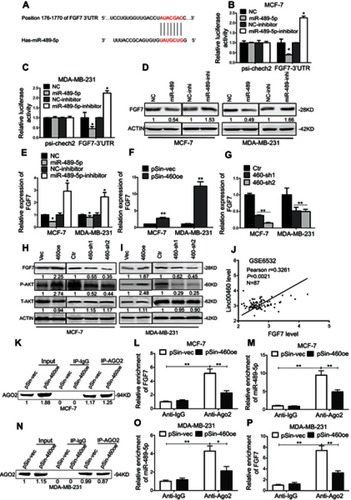
Figure 6 Abrogation of miR-489-5p/FGF7/AKT axis attenuates tumor-promoting effects of Linc00460. (A) MCF-7-pSin-460oe cells or –vector cells were transfected with miR-489-5p mimics or negative control scrambled oligonucleotides (NC), and their cell viabilities were assessed by MTT assay after 5 days. (B) Colony formation was determined in MCF-7-pSin-460oe cells or -vector cells transfected with miR-489-5p mimics or negative control scrambled oligonucleotides (NC) after 10 days of culture. (C–D) Migration and invasion of MCF-7-pSin-460oe cells or -vector cells transfected with miR-489-5p mimics or negative control scrambled oligonucleotides (NC) were determined by transwell assays. (E) MDA-MB-231-sh460 cells or control cells were transfected with miR-489-5p inhibitor or negative control scrambled oligonucleotides (NC inhibitor), and their cell viabilities were assessed by MTT assay after 5 days. (F) Colony formation was determined in MDA-MB-231-sh460 cells or control cells transfected with miR-489-5p inhibitor or negative control scrambled oligonucleotides (NC inhibitor) after 10 days of culture. (G–H) Migration and invasion of MDA-MB-231-sh460 cells or control cells transfected with miR-489-5p inhibitor or negative control oligonucleotides (NC-inhibitor) were determined by transwell assays. (I) Protein levels of FGF7 and phosphorylated and total AKT in MCF-7 cells (pSin-vec+NC,pSin-vec+miR-489-5p, pSin-460oe+NC, pSin-460oe+miR-489-5p) and MDA-MB-231 cells (Ctr+NC-inhi, Ctr+miR-489-5p-inhi, 460-sh2+NC-inhi, 460-sh2+miR-489-5p-inhi) were determined by Western blot. (J–K) Expression levels of FGF7 were examined by qRT-PCR in MCF-7 cells (pSin-vec+NC, pSin-vec+miR-489-5p, pSin-460oe+NC, pSin-460oe+miR-489-5p) and MDA-MB-231 cells (Ctr+NC-inhi, Ctr+miR-489-5p-inhi, 460-sh2+NC-inhi, 460-sh2+miR-489-5p-inhi). All data are present as mean ± SD from three independent experiments. *P<0.05; **P<0.01 (Student’s t-test).
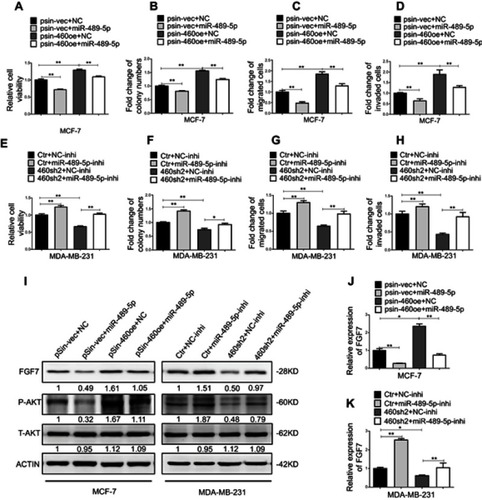
Figure 7 FGF7 and downstream signaling mediate the oncogenic roles of Linc00460 in breast cancer cells. (A) Protein levels of FGF7 and phosphorylated and total AKT in four groups of MCF-7 and MDA-MB-231 cells (pSin-vec+si-NC,pSin-vec+si-FGF7, pSin-460oe+si-NC, pSin-460oe+si-FGF7) were determined by Western blot with β-Actin as input control. (B–C) Expression levels of FGF7 were examined by qRT-PCR in four groups of MCF-7 and MDA-MB-231 cells (pSin-vec+si-NC,pSin-vec+si-FGF7, pSin-460oe+si-NC, pSin-460oe+ si-FGF7). GAPDH was used as input control. (D–E and H–I) MCF-7-pSin-460oe cells or -vector cells were transfected with FGF7 siRNAs (si-FGF7) or negative control scrambled oligonucleotides (si-NC). (D) Cell viabilities were assessed by MTT assay after 5 days. (E) Colony formation was quantified after 10 days of culture. (H–I) Migration and invasion were determined by transwell assays. (F–G and J–K) MDA-MB-231-pSin-460oe cells or -vector cells were transfected with FGF7 siRNAs (si-FGF7) or scrambled oligonucleotides (si-NC) (F) Cell viabilities assessed by MTT assay after 5 days. (G) Colony formation was quantified after 10 days of culture. (J–K) Migration and invasion were determined by transwell assays. All data are present as mean ± SD from three independent experiments. *P<0.05; **P<0.01 (Student’s t-test).
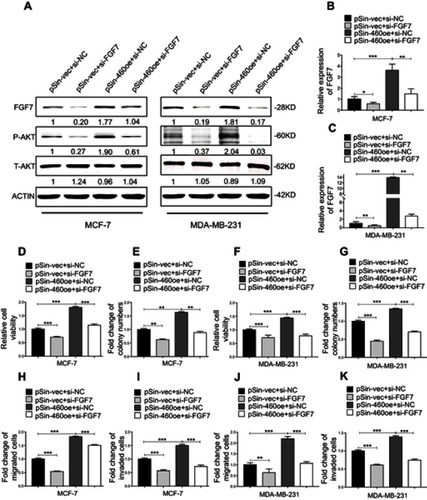
Table S1 Oligomers used in this study
Table S2 Antibodies used in this study