Figures & data
Table 1 Demographic and clinical characteristics of the study subjects
Table 2 Sequences of short-hairpin RNAs targeting inhibitor of DNA binding 1
Table 3 Primers for genes of interest
Figure 1 Id1 and CD133 expression in human colorectal cancer specimens and normal mucosal specimens. (A and B) higher Id1 (A) and CD133 (B) mRNA expression is detected in human colorectal cancer specimens than in matched normal mucosal specimens (P<0.05). The data are presented as mean ± SD. *P<0.05 vs the normal mucosal specimens; (C) Spearman correlation analysis reveals a positive correlation between Id1 and CD133 mRNA expression; (D) representative immunohistochemical staining of Id1 and CD133 expression (400×); (E) Spearman correlation analysis reveals a positive correlation between Id1 and CD133 protein expression in colorectal cancer patients.
Abbreviation: Id1, inhibitor of DNA binding 1.
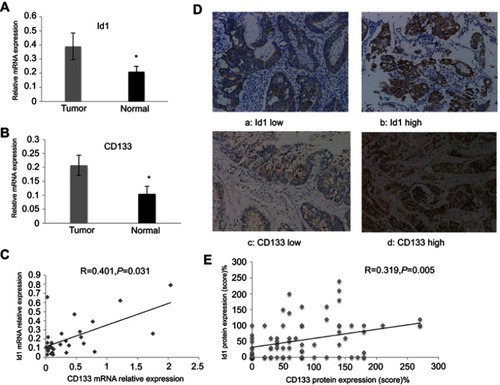
Table 4 Associations of Id1 and CD133 expression with clinicopathologic characteristics in colorectal cancer patients
Figure 2 Effects of inhibitor of DNA binding 1 (Id1) knockdown on cancer-initiating cell features in HCT116 cells. (A) Id1 knockdown efficiency is checked by Western blotting assay; (B) real-time cell analysis (RTCA) shows greater inhibition of Id1 knockdown HCT116 cells than control cells 48 h post-transfection; (C) fluorescence-activated cell sorting (FACS) analysis reveals a significant reduction in the number of Id1 knockdown HCT116 cells at S phase and a remarkable rise in the number of Id1 knockdown HCT116 cells at G0/G1 phase relative to controls cells (P<0.05); (D) cell colony-forming assay shows lower numbers of cell colonies in Id1 knockdown HCT116 cells than in control cells. *P<0.05 vs the control cells.
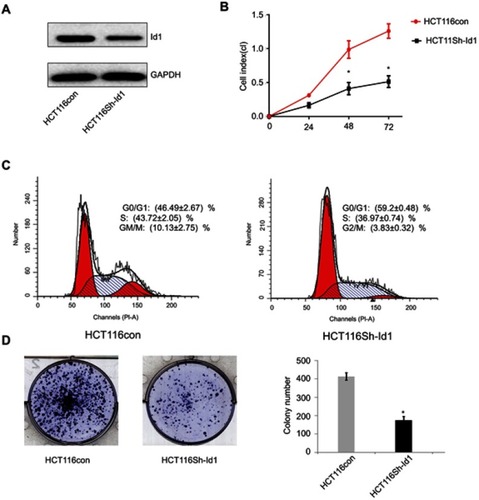
Figure 3 Inhibitor of DNA binding 1(Id1) promotes colorectal cancer cell stemness and tumor-initiating capability. (A) sphere-forming assay reveals higher sphere-forming rate of Id1 knockdown HCT116 cells than that of control cells (37% ±2.4% vs 14% ±1.8%) and larger Id1 knockdown HCT116 cells than controls cells (median diameter, 115.3±5.24 vs 41.67±3.48 μm), *P<0.01 vs the control cells; (B) fluorescence-activated cell sorting (FACS) analysis shows lower proportions of CD24+, CD24+/CD133+ and CD133+ cells in Id1 knockdown HCT116 cells than in control cells; (C) Western blotting determines lower CD24, CD133, EpCAM, Oct4, EZH2, Lgr5 and β-catenin expression in Id1 knockdown HCT116 cells than in controls cells, and no significant differences are seen in CD44 or CD166 expression between in Id1 knockdown HCT116 cells and control cells; (D) Western blotting determines significantly higher Id1 expression in sphere-forming HCT116 cells than in HCT116 cells; (E) slower growth of the xenograft tumor is seen from Id1 knockdown HCT116 cells than from HCT116 cells at a same cell dosing; (F) smaller xenograft tumors are measured from Id1 knockdown HCT116 cells than from HCT116 cells at a same cell dosing. *P<0.05 vs the control cells.
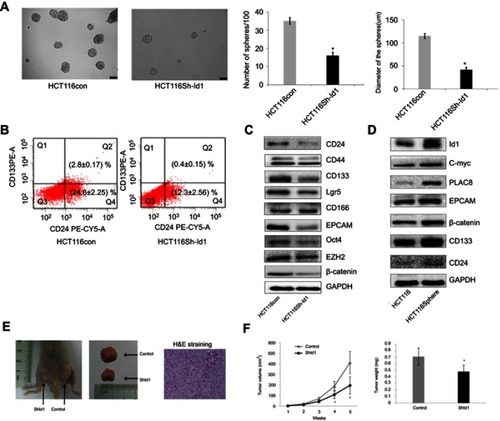
Table 5 Tumor incidence of inhibitor of DNA binding 1 (Id1) knocked down (KD) HCT116 and control HCT116 cells injected into nude mice
Figure 4 Inhibitor of DNA binding 1 (Id1) knockdown suppresses epithelial-mesenchymal transition (EMT) and increases chemosensitivity in HCT116 cells. (A) HCT116 cells have scattered, spindle- and fibroblastic-like shapes, and Id1 knockdown HCT116 cells have tightly packed, cuboid, epithelial-like appearance; (B) Western blotting analysis determines lower Twist, Snail, Vimentin and Slug expression and higher E-cadherin, ZO-1 and Claudin-1 expression in Id1 knockdown HCT116 cells than in HCT116 cells; (C) MTS assay measures a lower viability of Id1 knockdown HCT116 cells than that of control cells following 5-FU treatment, and the 5-FU IC50 values are 5.2±0.3 and 8.4±0.4 μM for the Id1 knockdown HCT116 cells and control cells, respectively; (D) flow cytometry detects a significantly higher apoptotic rate in Id1 knockdown HCT116 cells than in control cells following treatment with 5-FU at a dose of 10 μM. *P<0.05 vs the control cells.
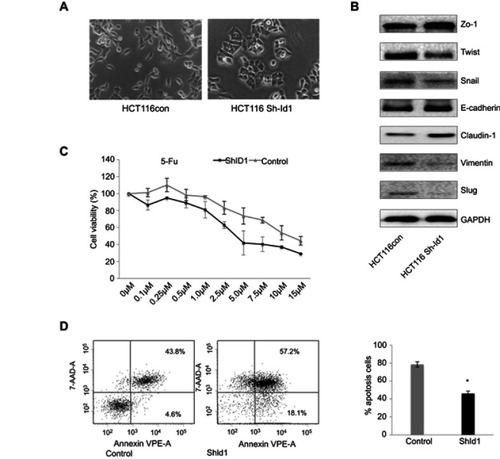
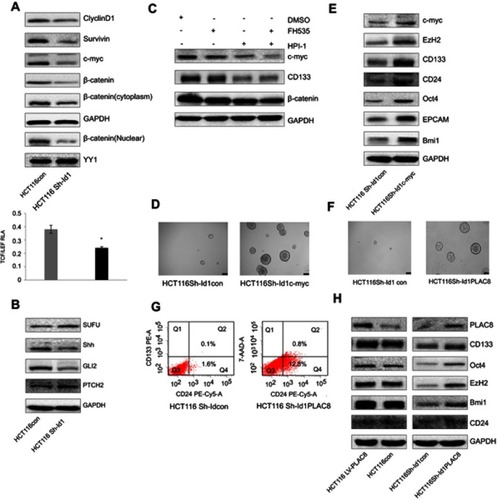
Figure 5 Inhibitor of DNA binding 1 (Id1) maintains the stemness of colorectal cancer cells through the Id1-c-Myc-PLAC8 axis via the Wnt/β-catenin and Sonic Hedgehog (Shh) signaling pathways. (A) Western blotting determines lower CyclinD1, Survivin, C-myc and cytoplasmic and nuclear β-catenin expression in Id1 knockdown HCT116 cells than in control cells, and lower relative TCF/LEF activity is measured in Id1 knockdown HCT116 cells than in control cells. *P<0.05; (B) Western blotting determines higher PTCH2 and SUFU expression and lower GLI2 and Shh expression in Id1 knockdown HCT116 cells than in control cells; (C) Western blotting determines lower C-myc expression in HCT116 cells exposed to FH535 and HPI-1 than in cell treated with FH535 or HPI-1 alone; (D) higher C-myc expression is seen in Id1 knockdown HCT116 cell overexpressing C-myc than in Id1 knockdown HCT116 cells; (E) Western blotting determines higher C-myc, EZH2, CD133, CD24, Oct4, EPCAM and Bmi1 expression in Id1 knockdown HCT116 cell overexpressing C-myc than in Id1 knockdown HCT116 cells; (F) lower PLAC8 expression is detected in Id1 knockdown HCT116 cells than in control cells; (G) fluorescence-activated cell sorting (FACS) analysis reveals a significant rise in the number of CD24+ and CD133+/CD24+ cell populations in Id1 knockdown HCT116 cells overexpressing PLAC8 than in control cells; (H) Western blotting determines higher C-myc, EZH2, CD133, CD24, Oct4, EPCAM and Bmi1 expression in Id1 knockdown HCT116 cells overexpressing PLAC8 relative to Id1 knockdown HCT116 cells.