Figures & data
Figure 1 ST6GAL1 suppressed tumor metastasis of CRC in vitro and in vivo. (A) Immunoblot analysis of ST6GAL1 in SW480 and SW620 cells; (B and C) The effects of overexpression and knockdown of ST6GAL1 by immunoblots; (D and E) The effects of overexpression and knockdown of ST6GAL1 by FACS; (F and G) Wound healing assay of ST6GAL1-OE cells and ST6GAL1-KD cells; (H and I) Transwell assay of ST6GAL1-OE cells and ST6GAL1-KD cells; (J) Representative images of the tumors in livers and the numbers of surface tumor nodules; (K) The expression of ST6GAL1 in tumor sections was assessed by IHC. Images of IHC were captured from three randomly selected fields using a phase-contrast microscope. Arrows indicate liver metastasis. The data were obtained from three independent experiments and presented as mean ± SD; **P<0.01 by paired t-test or Mann–Whitney U test.
Abbreviation: CRC, colorectal cancer.
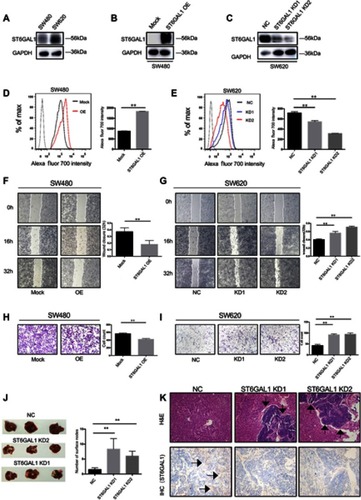
Figure 2 The potential substrate of ST6GAL1. (A–C) GO analysis of perturbed functions upon the overexpression of ST6GAL1 in terms of cellular component (CC), biological process (BP), and molecular function (MF), respectively; (D) Kyoto Encyclopedia of Genes and Genomes (KEGG) analysis indicated that ST6GAL1 is associated with cell adhesion molecules.
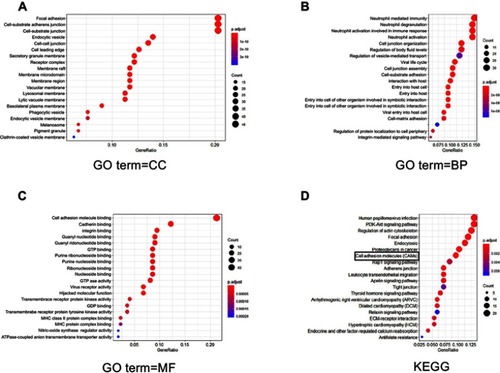
Figure 3 Stage-dependent expression of ICAM-1 in CRC progression. (A) Representative images of the immunoblot for ICAM-1 in primary colorectal tumors at different stages. For the rest of our immunoblot images, please refer to ; (B) ICAM-1 bands detected from the immunoblot were quantified by densitometric scanning and protein intensity values were normalized by GAPDH. The normalized ICAM-1 intensity in tumors was compared with that in its pair-matched normal tissues; (C) Correlation analysis of ST6GAL1 and ICAM-1 from the TCGA database suggested ICAM-1 was positively correlated with ST6GAL1; (D and E) Representative images of ICAM-1 expression in different stage of CRC tissue microarrays and the statistical analysis of the histochemistry score of the CRC tissue microarrays; (F and G) 3-year and 5-year relapse-free survival (RFS) of ICAM-1 high and low expression group. The cut-off value of ICAM-1 expression (Ratiotumor/normal =1.58) was based on Youden’s index from the ROC curve. *P<0.05 by paired t-test or Mann–Whitney U test).
Abbreviations: CRC, colorectal cancer; ICAM-1,intercellular adhesion molecule-1.
Figure 4 ST6GAL1 upregulated ICAM-1 by enhancing its stability. (A and B) Immunoblot analysis of ICAM-1 in ST6GAL1-OE cells and ST6GAL1-KD cells; (C and D) PCR analysis of ICAM-1 in ST6GAL1-OE cells and ST6GAL1-KD; (E and F) The sialylation pattern of ICAM-1 in ST6GAL1-OE and ST6GAL1-KD was investigated by immunoprecipitation; (G and I) The change of stability in ST6GAL1-OE cells and ST6GAL1-KD cells by treatment with 100 μg/mL cycloheximide (CHX) at various times. (H and J) The relative expression of ICAM-1 was normalized by GAPDH and the dash lines represented the remaining amount of ICAM-1 at indicated times in different cells. n.s: no significance,**P < 0.01 by paired t-test or Mann–Whitney U test.
Abbreviation: ICAM-1, intercellular adhesion molecule-1.
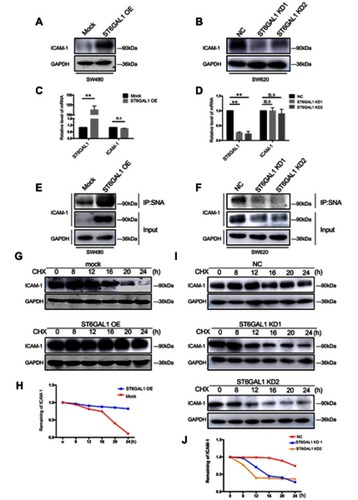
Figure 5 Sialylation of soluble ICAM-1 (sICAM-1) in serum correlates with colorectal cancer staging. (A and B) The sialylation pattern of sICAM-1 in serum was investigated by lectin precipitation and its protein level in serum was analyzed by immunoblot; (C and D)The ratio of relative density(elution/input) and the protein level of sICAM-1 were presented as mean ± SD; *P<0.05 by paired t-test.
Abbreviation: ICAM-1, intercellular adhesion molecule-1.
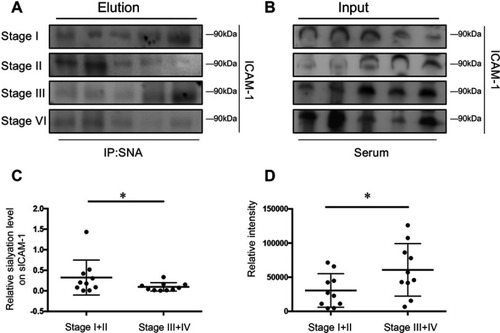
Figure S1 (A) Survival analysis of COAD patients with different status of ST6GAL1 from TCGA cohort. (B) The intensity ratio (ST6GAL1 OE/mock) of ICAM-1 was shown based on the MS analysis.
Abbreviations: COAD, colon adenocarcinoma; MS, mass spectrometry; ICAM-1, intercellular adhesion molecule-1.
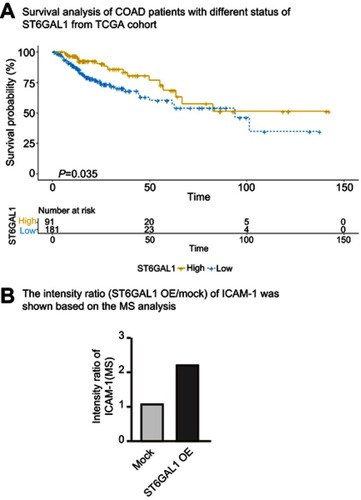
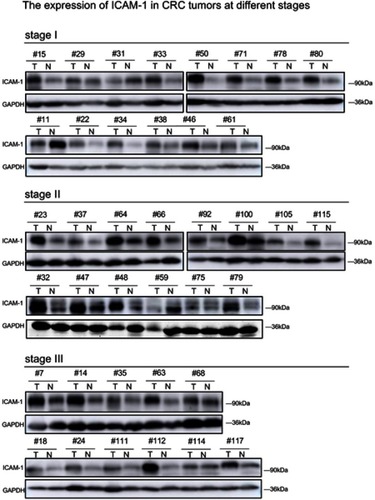
Figure S2 The expression of ICAM-1 in CRC tumors at different stages.
Abbreviations: ICAM-1, intercellular adhesion molecule-1; CRC, colorectal cancer.