Figures & data
Figure 1 miR-625 is downregulated in MDR gastric cancer cells. (A and B) SGC7901/ADR (A) and SGC7901/VCR (B) were obtained from parental SGC7901 cells by stepwise selection of vincristine (VCR) and adriamycin (ADR) treatment, respectively. 1 mg/ml VCR and 0.5 mg/ml ADR were used to maintain their MDR phenotype. SGC7901/ADR cells were treated with 10 µg/ml ADR (A) and SGC7901/VCR cells were treated with 10 µg/ml VCR (B) for consecutive days as indicated. The parental SGC7901 cell line was used as a negative control. The drug sensitivity was determined by MTT assay. The percentage of viable cells is shown (%). Each treatment condition was performed in 5 replicates. (C and D) The expression of miR-625 in SGC7901/ADR cells (C) and SGC7901/VCR cells (D) was determined by qRT-PCR analysis. Results were normalized to U6 snRNA and expressed as relative to SGC7901 cells. Each column represents the mean value from 3 replicates. Data are presented as the mean ± SEM. ANOVA with a post hoc Dunnett’s test (A and B); Two-tailed Student’s t-test (C and D). **P<0.01.
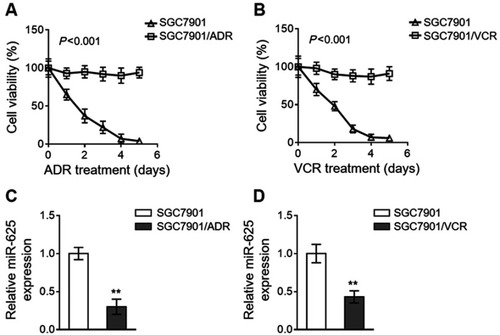
Figure 2 miR-625 increases drug sensitivity in MDR gastric cancer cells. (A) SGC7901 cells were transfected with antagomir-625 or negative control antagomir (antagomir-NC). At 2 days after transfection, the miR-625 level was determined by qRT-PCR analysis. Results were normalized to U6 snRNA. The expression relative to that in antagomir-NC group is shown. Each column represents the mean value from 3 replicates. (B) SGC7901 cells were transfected as in (A), and further treated with ADR, VCR, 5FU and CDDP for 2 days. The drug sensitivity was determined by MTT assay. The IC50 is shown. Each concentration treatment was performed in 5 replicates. (C and D) SGC7901/ADR (C) and SGC7901/VCR (D) cells were transfected with mimic-mir625 or negative control (mimic-NC). At 2 days after transfection, the miR-625 level was was determined by qRT-PCR analysis. Results were normalized to U6 snRNA. The expression relative to that in mimic-NC group is shown. Each column represents the mean value from 3 replicates. (E and F) SGC7901/ADR cells (E) and SGC7901/VCR cells (F) were transfected as in (C and D), and further treated with ADR, VCR, 5FU and CDDP for 2 days. The drug sensitivity was determined by MTT assay. The IC50 is shown. Each concentration treatment was performed in 5 replicates. Data are presented as the mean ± SEM. Two-tailed Student’s t-test. **P<0.01; *P<0.05.
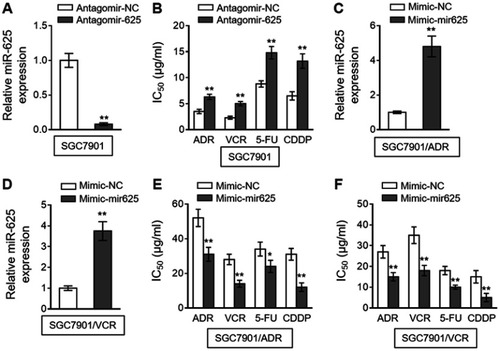
Figure 3 miR-625 promotes chemotherapeutic agent-induced apoptosis in MDR gastric cancer cells. (A) SGC7901 cells were transfected with antagomir-625 or antagomir-NC. At 2 days after transfection, cells were further treated with 1 µg/ml ADR, 0.5 µg/ml VCR, 5 µg/ml 5FU and 2 µg/ml CDDP for 2 days. The protein levels of Bax, Bcl-2, and cleaved caspase 3 were determined by Western blot analysis. β-actin was utilized as a loading control. The representative results from 3 independent experiments are shown. (B and C) SGC7901/ADR cells (B) and SGC7901/VCR cells (C) were transfected with mimic-mir625 or mimic-NC. At 2 days after transfection, cells were further treated with 1 µg/ml ADR, 0.5 µg/ml VCR, 5 µg/ml 5FU and 2 µg/ml CDDP for 2 days. The protein levels of Bax, Bcl-2, and cleaved caspase 3 were determined by Western blot analysis. β-actin was utilized as a loading control. The representative results from 3 independent experiments are shown.
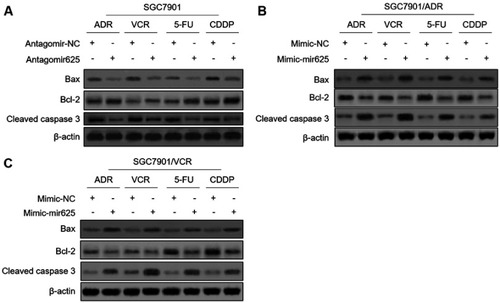
Figure 4 miR-625 directly targets ALDH1A1. (A) The schematic representation of complimentary sequences between miR-625 and 3ʹ-UTR of ALDH1A1. (B) SGC7901 cells were transfected with antagomir-625 or antagomir-NC in combination with luciferase reporter construct containing wild-type or mutant 3ʹ-UTR of ALDH1A1. At 2 days after transfection, the luciferase activity was measured. The firefly luciferase activity was normalized to that of Renilla luciferase. Each treatment condition was performed in triplicate. (C) SGC7901 cells were transfected with mimic-mir625 or mimic-NC in combination with luciferase reporter construct containing wild-type or mutant 3ʹ-UTR of ALDH1A1. At 2 days after transfection, the luciferase activity was measured. The firefly luciferase activity was normalized to that of Renilla luciferase. Each treatment condition was performed in triplicate. (D) The mRNA level of ALDH1A1 in SGC7901/ADR and SGC7901/VCR cells was determined by qRT-PCR analysis. Results were normalized to U6 snRNA. The expression relative to that in parental SGC7901 cells is shown. Each column represents the mean value from 3 replicates. (E) The protein level of ALDH1A1 in parental SGC7901 cells, SGC7901/ADR cells and SGC7901/VCR was determined by Western blot analysis. β-actin was utilized as a loading control. The representative results from 3 independent experiments are shown. (F) SGC7901 cells were transfected with antagomir-625 or antagomir-NC. At 2 days after transfection, the protein level of ALDH1A1 was determined by Western blot analysis. (G) SGC7901/ADR cells and SGC7901/VCR cells were transfected with mimic-mir625 or mimic-NC. At 2 days after transfection, the protein level of ALDH1A1 was determined by Western blot analysis. β-actin was utilized as a loading control. The representative results from 3 independent experiments are shown. Data are presented as the mean ± SEM. Two-tailed Student’s t-test. **P<0.01; NS, not significant.
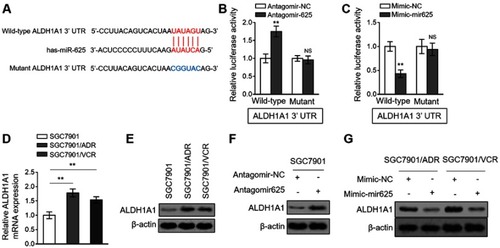
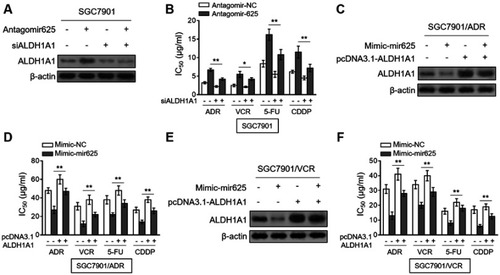
Figure 5 Restored ALDH1A1 expression reverses miR-625 effect on MDR in gastric cancer cells. (A) SGC7901 cells were transfected with antagomir-625 or antagomir-NC in combination with control siRNA or ALDH1A1 siRNA (siALDH1A1). At 2 days after transfection, the protein level of ALDH1A1 was determined by Western blot analysis. β-actin was utilized as a loading control. The representative results from 3 independent experiments are shown. (B) SGC7901 cells were transfected as in (A), and further treated with ADR, VCR, 5FU and CDDP for 2 days. The drug sensitivity was determined by MTT assay. The IC50 is shown. Each concentration treatment was performed in 5 replicates. (C) SGC7901/ADR cells were transfected with mimic-625 or mimic-NC in combination with pcDNA3.1 vector or pcDNA3.1 ALDH1A1. At 2 days after transfection, the protein level of ALDH1A1 was determined by Western blot analysis. β-actin was utilized as a loading control. The representative results from 3 independent experiments are shown. (D) SGC7901/ADR cells were transfected as in (C), and further treated with ADR, VCR, 5FU and CDDP for 2 days. The drug sensitivity was determined by MTT assay. The IC50 is shown. Each concentration treatment was performed in 5 replicates. (E) SGC7901/VCR cells were transfected as in (C). The protein level of ALDH1A1 was determined by Western blot analysis. β-actin was utilized as a loading control. The representative results from 3 independent experiments are shown. (F) SGC7901/VCR cells were transfected as in (C), and further treated with ADR, VCR, 5FU and CDDP for 2 days. The drug sensitivity was determined by MTT assay. The IC50 is shown. Each concentration treatment was performed in 5 replicates. Data are presented as the mean ± SEM. Two-tailed Student’s t-test. **P<0.01; *P<0.05.