
Figures & data
Table 1 Patient Baseline Characteristics in the Main Analysis of ≥1 Circulating Tumor Cell
Table 2 Median Circulating Tumor Cell Values at Each Assessment
Table 3 Response by Change in Circulating Tumor Cell (CTC) Levels from Baseline in the Main Analysis of ≥1 CTC
Figure 1 Efficacy outcomes by change in circulating tumor cell levels from baseline. Kaplan–Meier plots of (A) PFS and (B) OS.
Notes: Group 1 (+ + +), elevated at baseline and elevated postbaseline; Group 2 (+ ± ±), elevated at baseline and cleared postbaseline (cycle 3 and/or cycle 5); Group 3 (−), no CTCs detected at baseline. a vs Group 1.
Abbreviations: HR, hazard ratio; OS, overall survival; PFS, progression-free survival.
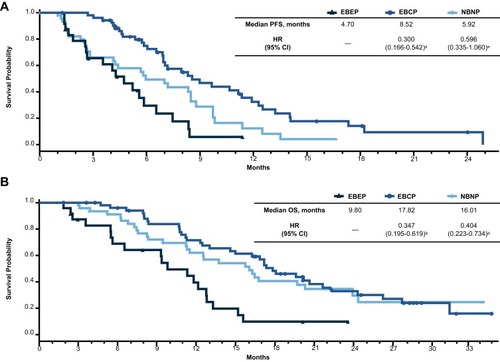
Figure 2 Efficacy outcomes by the absence or presence of circulating tumor cells at baseline. Kaplan–Meier plots of (A) PFS and (B) OS.
Abbreviations: CTC, circulating tumor cell; HR, hazard ratio; OS, overall survival; PFS, progression-free survival.
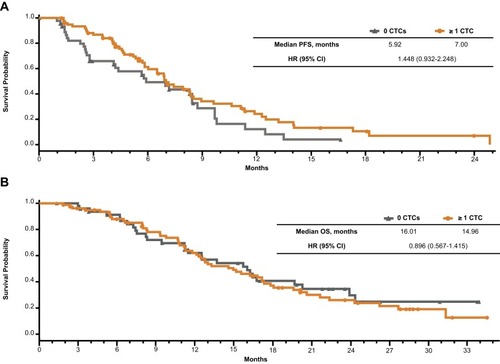
Table 4 PFS by Treatment Arm and Change in Circulating Tumor Cell (CTC) Levels from Baseline in the Main Analysis of ≥1 CTC