Figures & data
Table 1 Sequences of oligomers and primers used in the study
Figure 1 The expression profile of miR-216a-5p in CRC tissues and its correlation with clinicopathological parameters of CRC patients. (A) RT-qPCR results showing significant downregulation of miR-216a-5p in CRC tissues than in adjacent normal tissues. (B) Waterfall plot showing relatively low expression of miR-216a-5p in 77.14% (54/70) patients; the data are represented as Log2 (T/N). Scatter plots showing correlation analysis between miR-216a-5p expression and (C) tumor differentiation, (D) tumor size, (E) T stage, and (F) N stage of the tumor. (G) Kaplan–Meirr plot showing the correlation between miR-216a-5p expression and duration of disease-free survival (DFS) in patients. Note that each dot represents a patient. **P<0.01, ***P<0.001, N.S. means “not significant.”
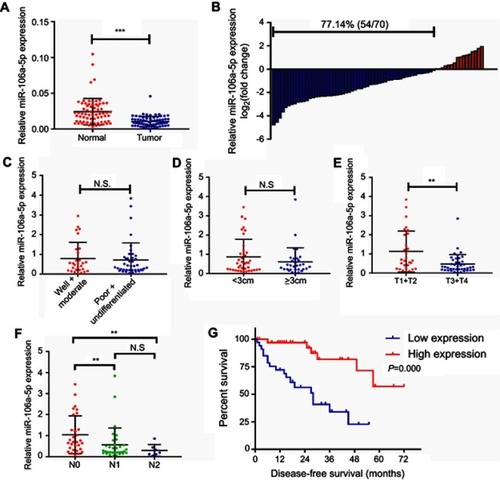
Table 2 Correlation between miR-216a-5p expression and clinicopathological characteristics of colorectal cancer patients
Table 3 Cox analyses of disease-free survival in colorectal cancer patients
Figure 2 Overexpression of miR-216a-5p suppresses the proliferation of CRC cells in vitro. (A) Bar diagram showing the relatively low expression of miR-216a-5p in CRC cell lines (HT-29, LoVo, SW480, HCT-116, and Caco-2) as compared to normal intestinal cell line (FHC). (B and C) RT-qPCR results showing the overexpression of miR-216a-5p in stable OE-miR-216a-5p LoVo and HCT-116 cell lines, as compared to OE-vector cells. (D and E) CCK-8 assay showing the effect of miR-216a-5p upregulation on proliferation of LoVo and HCT-116 cells. All experiments were repeated at least three times. ***P<0.001, N.S. means “not significant.”
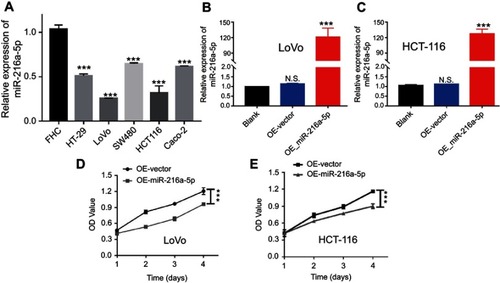
Figure 3 MiR-216a-5p suppresses migration, invasion, and EMT in CRC cell lines. Transwell assay showing reduced (A) cell migration and (B) cell invasion upon overexpression of miR-216a-5p in HCT-116 and LoVo cell. (C) Immunoblots showing increased and decreased expression of E-cadherin (epithelial marker) and N-cadherin/Vimentin/Snail (mesenchymal markers) respectively, upon overexpression of miR-216a-5p in HCT-116 and LoVo cells. ***P<0.001.
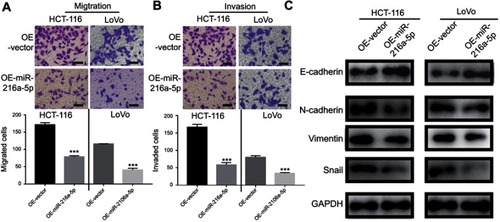
Figure 4 MiR-216a-5p is a direct target of lncRNA PVT1 in CRC. (A) Waterfall plot showing relatively high expression of PVT1 in 83.33% (25/30) patients; the data are represented as Log2 (T/N). (B) Scatter plot showing higher expression of PVT1 in CRC tissues than that of adjacent normal tissues, evaluated by RT-qPCR. (C) Correlation analysis between the expression level of miR-216a-5p and PVT1 in 30 paired CRC tissues. (D) Illustration is showing the predicted sequence of the miR-216a-5p binding site on 3ʹUTR of PVT1 mRNA. Sequence of the mutated binding site in PVT1 is also represented. (E) The relative luciferase activity pmirGLO-PVT1-WT or pmirGLO-PVT1-MUT 293T cells, upon transfection with miR-216a-5p mimics or negative control (miR-216a-5p NC). (F) RT-qPCR data showing the relative expression of miR-216a-5p in OE-miR-216a-5p cells, upon overexpression of PVT1. *P<0.05, ***P<0.001.
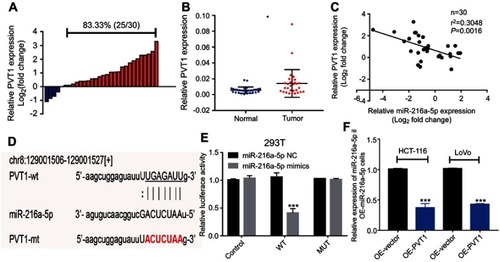
Figure 5 Upregulation of PVT1 reverses the anti-proliferative effect of miR-216a-5p overexpressed (OE- miR-216a-5p) CRC cells. (A and B) CCK-8 assay showing the effect of PVT1 upregulation on proliferation of OE-miR-216a-5p LoVo and HCT-116 cells. Transwell assay showing increased (C) cell migration and (D) cell invasion upon overexpression of PVT1 in OE-miR-216a-5p cells. (E) Immunoblots showing decreased and increased expression of E-cadherin (epithelial marker) and N-cadherin/Vimentin/Snail (mesenchyme markers) respectively, upon overexpression of PVT1 in OE-miR-216a-5p cells. ***P<0.001.
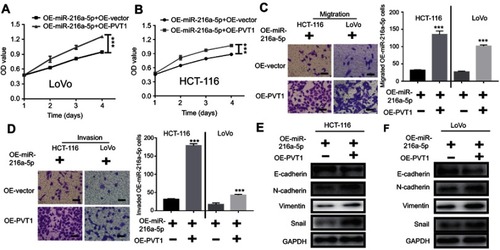
Figure 6 YBX1 might be the key target of PVT1/miR-216a-5p axis in CRC. (A) Predicted target genes of miR-216a-5p from TargetScan and miRanda databases, with 200 common predicted targets. (B) Venn diagram representing the potential 10 target genes, regulated by both PVT1 and miR-216a-5p. (C) Protein–protein interaction networks of the 10 target genes regulated by PVT1/miR-216a-5p axis using STRING database. (D) RT-qPCR data showing the relative expression of YBX1 mRNA in miR-216a-5p and/or PVT1 upregulated CRC cells. (E) Illustration showing the predicted sequence of the miR-216a-5p binding site on 3ʹUTR of YBX1 mRNA. Sequence of the mutated binding site in YBX1 is also represented. (F) The relative luciferase activity pmirGLO-YBX1-WT or pmirGLO-YBX1-MUT 293T cells, upon transfection with miR-216a-5p mimics or negative control (miR-216a-5p NC). ***P<0.001.
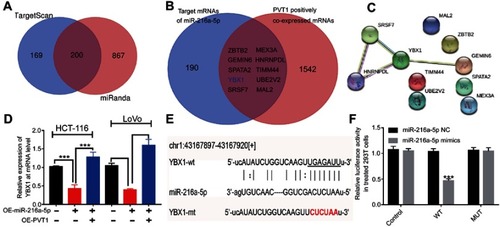
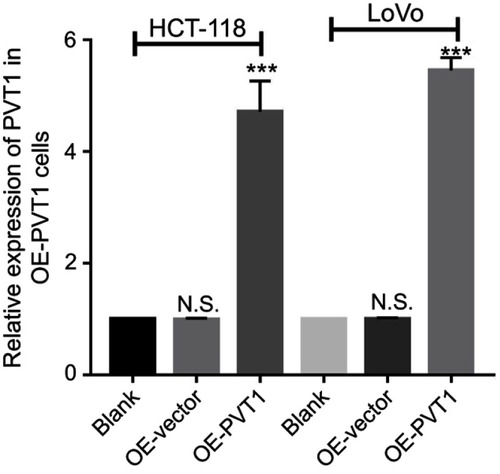
Figure S1 The overexpression efficiency of PVT1 by a lentivirus-based method in LoVo and HCT-116 cell lines.
Note: ***P<0.001, N.S. means not significant.