Figures & data
Table 1 Correlation between TGFBI expression and clinicopathological characteristics of BCa patients
Table 2 Comparing clinical features between BCa patients with low and high TGFBI levels in TCGA database
Figure 1 Upregulation of TGFBI was correlated with poor survival prognosis and invasive progresses of BCa. (A–C) TGFBI mRNA expression levels were increased in MIBC tissues (≥T2) compared with NMIBC tissues (Ta or T1) obtained from the three publicly accessible BCa datasets (GSE32548, GSE13507, and GSE89). (D–F) From TCGA urothelial cancer specimen cohorts, compared with the patients with low expression level of TGFBI (the lower 35%), the patients with high mRNA expression (the upper 35%) of TGFBI had higher death rates, shorter DFS, and OS. (G) Immunohistochemistry analysis of the expression of TGFBI protein in normal tissues and BCa tissues at different tumor stages. (H) Differences in expression levels of TGFBI protein in normal, NMIBC (Ta or T1), and MIBC tissues (≥T2).
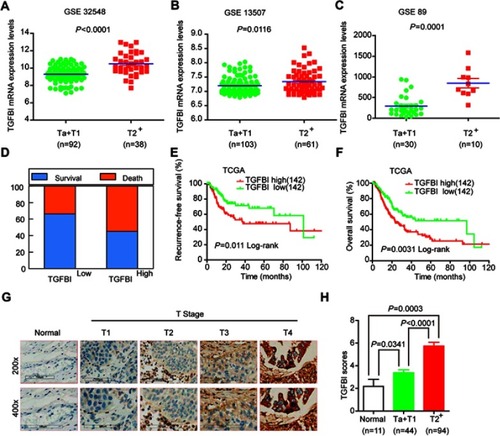
Figure 2 The silencing of TGFBI inhibits the malignant phenotypes of BCa cells. (A, B) TGFBI expression was silenced in 5637 and T24 cells, which were detected by RT-q-PCR and Western blotting. (C–F) The effects of TGFBI silencing on 5637 and T24 cell proliferation (C, D), colony formation (E), and migration and invasion (F) were detected. (G) After TGFBI silencing, EMT markers were detected by Western blotting. **P<0.01 and ***P<0.001 were considered statistically significant.
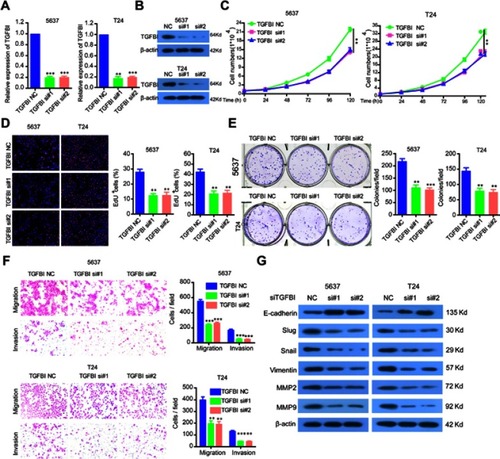
Figure 3 The stable overexpression of TGFBI promotes the malignant phenotypes of BCa cells. (A, B) The stable overexpression of TGFBI was detected by RT-q-PCR and Western blotting in 5637 and T24 cells. (C–F) The effects of stable overexpression of TGFBI on cell proliferation (C, D), colony formation (E), and migration and invasion (F) were detected. (H) After stable overexpression of TGFBI, EMT markers were detected by Western blotting in 5637 and T24 cells. *P<0.05 and **P<0.01 were considered statistically significant.
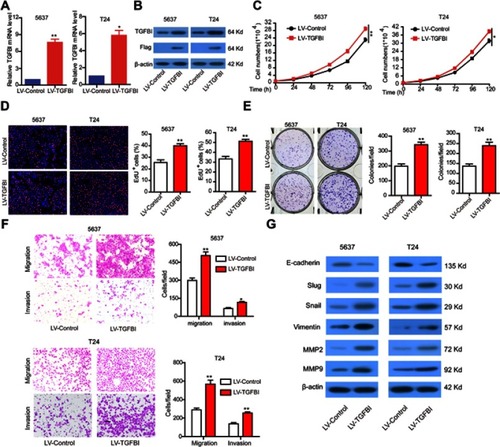
Figure 4 TGFBI in the supernatant promotes the malignant phenotypes of BCa cells. (A) TGFBI was efficiently secreted to cell culture medium. (B–D) The conditional medium derived from 5637/LV-TGFBI and T24/LV-TGFBI cells was treated to 5637 and T24 cells, respectively. The effects of TGFBI in the supernatant on cell proliferation (B) migration and invasion (C), and EMT markers (D) were detected. **P<0.01 and ***P<0.001 were considered statistically significant.
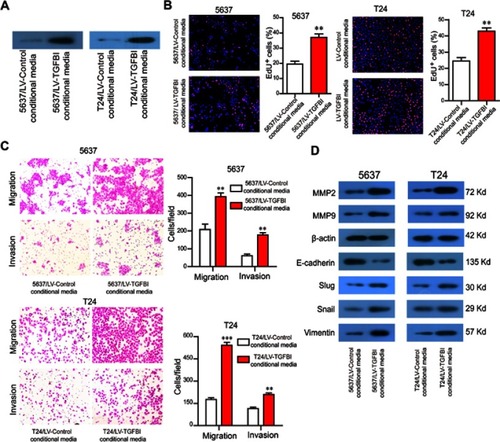
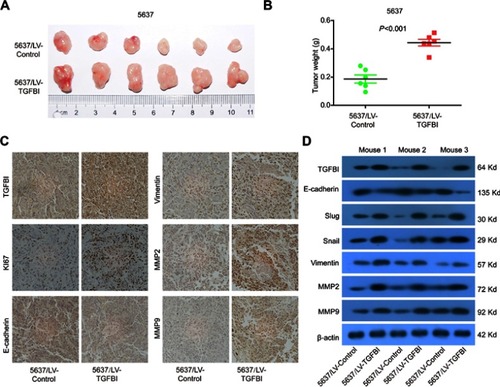
Figure 5 TGFBI promoted the tumorigenicity of BCa cells in vivo. (A) Representative images of tumors in5637/LV-control and 5637/LV-TGFBI groups in nude mice. (B) Weights of the xenograft tumors are presented (n=6). (C) Representative images of TGFBI, KI67, E-cadherin, Vimentin, MMP2, and MMP9 in tumors formed by the indicated cells. (D) Tumors were lysed, and the total levels of TGFBI, EMT markers, and GAPDH were detected by Western blotting.