Figures & data
Table 1 Patient characteristics
Table 2 Operative and postoperative outcomes
Table 3 Pathological outcomes
Table 4 Local and distant recurrence
Figure 1 The overall survival curve clears that 5-year overall survival rate in the NOSE group and LAP group were 92.3% and 94.2%, respectively. There was no significant difference between the NOSE and LAP groups (p=0.985). NOSE, totally laparoscopic anterior resection with transanal specimen extraction; LAP laparoscopic anterior resection with minilaparotomy.
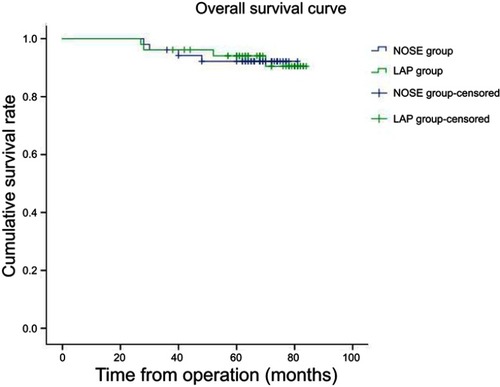
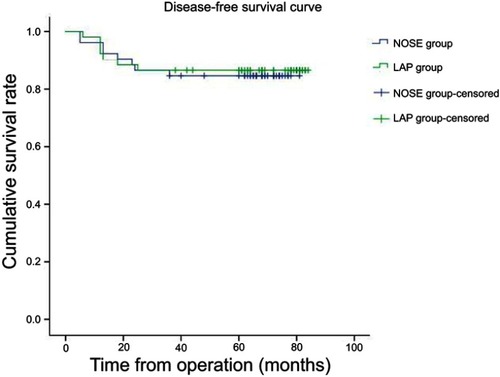
Figure 2 The disease-free survival curve clears that 5-year disease-free survival rate in the NOSE group and LAP group were 84.6% and 86.5%, respectively. There was no significant difference between the NOSE and LAP groups (p=0.802). NOSE, totally laparoscopic anterior resection with transanal specimen extraction; LAP laparoscopic anterior resection with minilaparotomy.