Figures & data
Figure 1 (A–C) Immunohistochemical staining for B7-H3 in tumor cells and the tumor vasculature of clear cell renal cell carcinoma. (A) Representative tumor with low B7-H3 expression in tumor cells and the tumor vasculature. (B) Representative tumor with high B7-H3 expression in tumor cells. (C) Representative tumor with high B7-H3 expression in the tumor vasculature. (D and E) Immunohistochemical staining for FOXP3 in tumor-infiltrating cells in clear cell renal cell carcinoma. (D) Representative tumor with a low FOXP3+ cell density. (E) Representative tumor with a high FOXP3+ cell density. Scale bar, 100 µm.
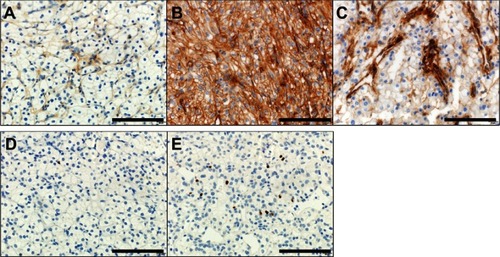
Table 1 Clinicopathological characteristics of clear cell renal cell carcinoma according to B7-H3 expression in tumor cells and the tumor vasculature
Table 2 The associations of B7-H3 expression with clinicopathological features in clear cell renal cell carcinoma
Table 3 B7-H3 expression and patient mortality* in clear cell renal cell carcinoma, stratified by density of tumor-infiltrating FOXP3+ cells
Figure 2 Kaplan–Meier curves for disease-specific survival (A) and overall survival (B) in patients with clear cell renal cell carcinoma according to B7-H3 expression in tumor cells. Kaplan–Meier curves for disease-specific survival (C) and overall survival (D) in patients with clear cell renal cell carcinoma according to B7-H3 expression in the tumor vasculature.
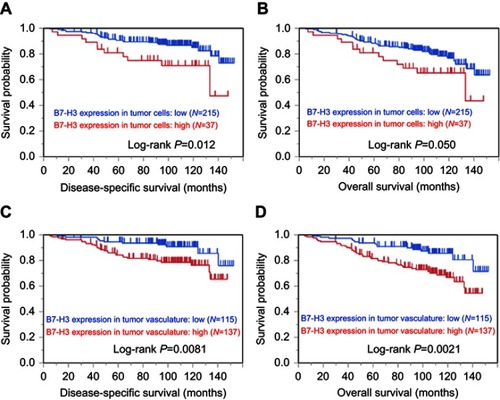
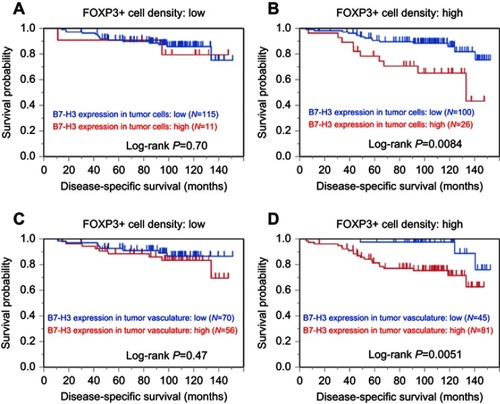
Figure 3 Kaplan–Meier curves for disease-specific survival in patients with clear cell renal cell carcinoma according to B7-H3 expression in tumor cells (A and B) and the tumor vasculature (C and D), stratified by the density of tumor-infiltrating FOXP3+ cells. (A and C) Low FOXP3+ cell density group. (B and D) High FOXP3+ cell density group.