Figures & data
Table 1 Assessment of nutrition status by controlling nutritional status (CONUT) scoring system
Figure 1 ROC curve for CONUT score.
Abbreviations: ROC, receiver operating characteristic; CONUT score, controlling nutritional status score.
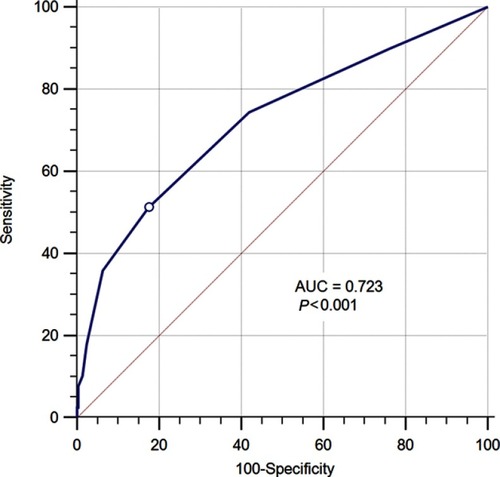
Table 2 Clinicopathological characteristics of the 325 patients according to different controlling nutritional status (CONUT) groups
Table 3 Univariate and multivariate analyses of clinicopathological parameters to predict CSS, DFS and OS in patients with non-metastatic RCC
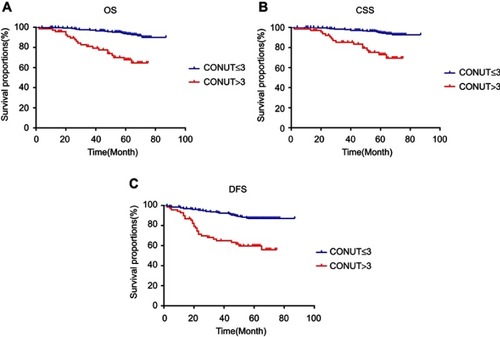
Figure 2 Kaplan–Meier survival curves for non-metastatic RCC patients treated with surgery. Survival curves set at cut-off value 2 for OS (A), CSS (B) and DFS (C).
Abbreviations: RCC, renal cell carcinoma; OS, overall survival; CSS, cancer-specific survival; DFS, disease-free survival; CONUT, controlling nutritional status.