Figures & data
Table 1 Baseline Characteristics Of Patients With Advanced Lung Adenocarcinoma From Xiangya Hospital
Figure 1 (A) Volcano plot of the expression of immune-related genes in patients with favorable rather than poor prognoses. (B) Heatmap of DEGs in patients with favorable and poor prognoses. (C) Boxplots of DEGs in patients with favorable and poor prognoses (center line: median, box: second and third quartiles, bars: 95% CI, points: outliers).
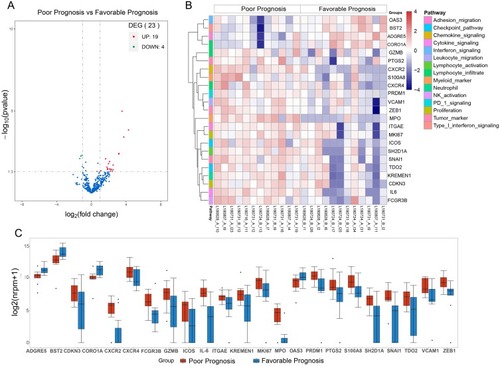
Figure 2 Heat map of GSVA enrichment scores of immune-related pathways in patients with favorable and poor prognoses.
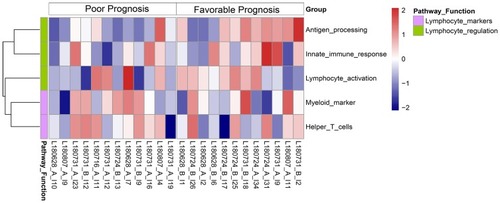
Table 2 Univariate And Multivariate Cox Hazard Analysis Of The Association Of Different Tumor Immunological Infiltrates With PFS (Xiangya Hospital Data, N = 24)
Figure 3 Kaplan-Meier survival analyses of the relationships of different immunological infiltrates with DFS, in which the median value of each MCP-counter score of immune infiltrates was used as the cutoff (Xiangya Hospital LUAD data, n = 24).
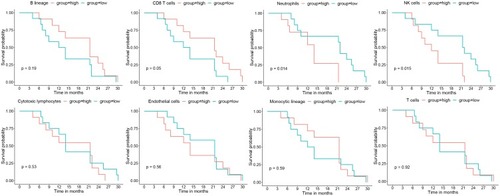
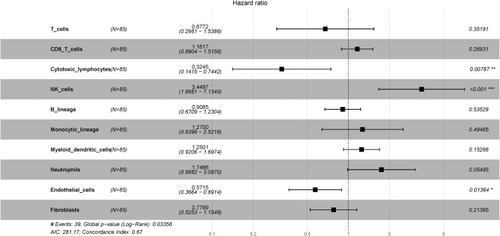
Figure 4 Forest plot showing multivariate Cox regression analysis of the effect of different tumor immunological infiltrates on DFS (TCGA LUAD data, n = 85). *P<0.05; **P<0.01.
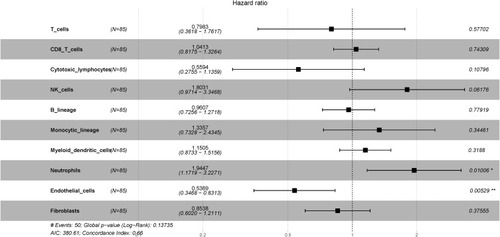
Figure 5 Forest plot showing multivariate Cox regression analysis of the effect of different tumor immunological infiltrates on OS (TCGA LUAD data, n = 85). *P<0.05; **P<0.01; ***P<0.001.