Figures & data
Figure 1 Transduction of hP-MSCs and HT29 cells with DF reporter genes, respectively. (A) The DF reporter gene composed of Fluc and HSV-ttk was driven by an ubiquitin promoter. (B and C) Imaging signals analysis of stably transduced hP-MSCs shows a good correlation between cell numbers and Fluc reporter gene activity in vitro. (D) The DF reporter gene composed of Rluc and eGFP was driven by the ubiquitin promoter. (E and F) The analysis of the image data showed that there was a strong correlation between the cell numbers of HT29 cells and the activity of the Fluc reporter gene, which were stably transfected.
Abbreviations: hP-MSCs, human placenta-derived MSCs; DF, double fusion; Fluc, firefly luciferase; HSV-ttk, herpes simplex virus truncated thymidine kinase; Rluc, renilla luciferase; GFP, green fluorescence protein; BLI, bioluminescence imaging; MSC, mesenchymal stem cells.
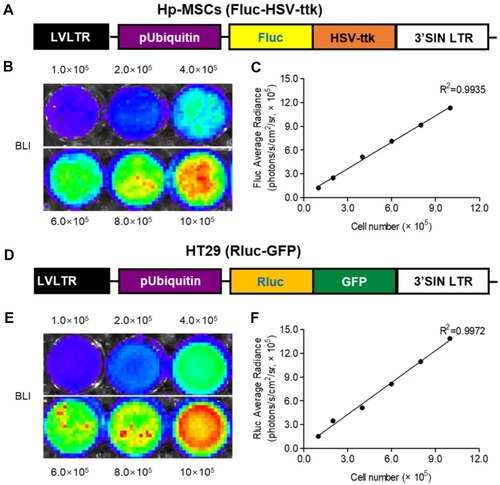
Figure 2 MSCs-DF were highly sensitive to GCV and had the bystander effect on HT29 cells in vitro. (A) MSCs-DF cells were plated and treated with different concentrations of GCV (0, 5, 10, 20, 30 and 40 μg/mL). The survival of MSCs-DF cells was determined by BLI assay for 3 days. (B) BLI signals were quantitatively analyzed in the presence of different concentrations of GCV, and the signal activity was expressed as photons/s per cm2 per steradian (sr). (C) Mixtures of MSCs-DF and HT29-DF cells in the ratios (MSCs-DF:HT29-DF = 0, 1:10, 1:5, 1:2, 1:1) were plated and were treated with GCV (40 μg/mL), and the numbers of HT29-DF cells were revealed by BLI assay for 3 days. (D) The viability of HT29 cells was measured by the relative radiance compared to Control on day 3. (E) When the ratio of MSCs-DF cells to HT29 cells was 1:1, the cell viability of HT29 was measured as mentioned above. Experiments were performed in triplicate. MSCs-DF, hP-MSCs-DF; MSCs-DF+GCV, hP-MSCs-DF+GCV.
Abbreviations: hP-MSCs, human placenta-derived MSCs; MSC, mesenchymal stem cells; DF, double fusion; BLI, bioluminescence imaging; GCV, ganciclovir.
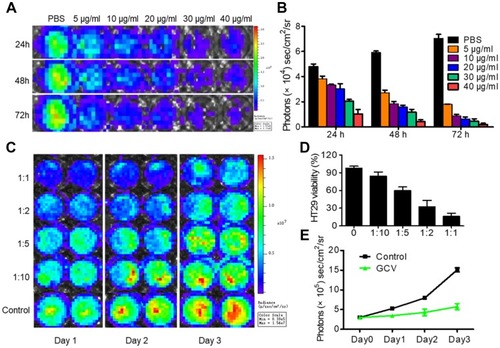
Figure 3 MSCs-DF inhibited tumor growth through the HSV-ttk system in vivo. (A) Rluc imaging of tumor progression. (B) Schematic diagram of MSCs-DF cells in the treatment of colon cancer. (C) Quantitative analysis of Rluc signal. Data are expressed as mean ± SEM. n=6. *P<0.05 versus PBS; #P<0.05 versus MSCs-DF. (D) Fluc imaging of MSCs-DF with GCV and without GCV. (E) BLI signals were quantitatively analyzed, and the signal activity was expressed as photons/s/cm2/steradian (sr). Experiments were performed in triplicate. MSCs-DF, hP-MSCs-DF; MSCs-DF+GCV, hP-MSCs-DF+GCV.
Abbreviations: MSC, mesenchymal stem cells; DF, double fusion; HSV-ttk, herpes simplex virus truncated thymidine kinase; Rluc, renilla luciferase; Fluc, firefly luciferase; GCV, ganciclovir; BLI, bioluminescence imaging; hP-MSCs, human placenta-derived MSCs.
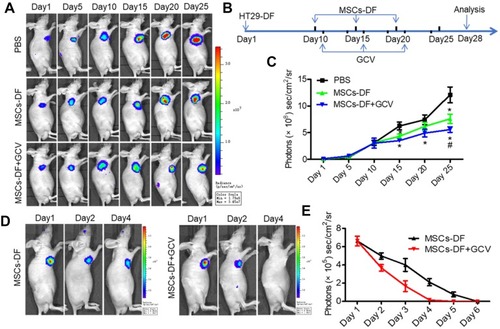
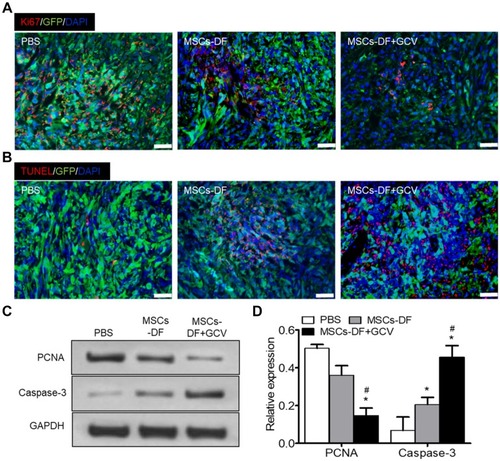
Figure 4 MSCs-DF reduced tumor proliferation and promoted apoptosis in vivo. (A) Proliferation protein was measured by the Ki67 assay. (B) The cell apoptosis was detected by the TUNEL assay. (C) Expression of proliferation marker PCNA and apoptosis marker cleaved Caspase-3 was analyzed by Western blotting. (D) Quantitative data of the expression of PCNA and Caspase-3. Data are expressed as mean ± SEM. n=6. *P<0.05 versus PBS; #P<0.05 versus MSCs-DF. Scale bar, 100 μm. Experiments were performed in triplicate. MSCs-DF, hP-MSCs-DF; MSCs-DF+GCV, hP-MSCs-DF+GCV.
Abbreviations: MSC, mesenchymal stem cells; DF, double fusion; hP-MSCs, human placenta-derived MSCs; GCV, ganciclovir.