Figures & data
Figure 1 HOXC6 is overexpressed in GBM. (A) HOXC6 mRNA expression of GBM tissues is higher than normal tissues due to ONCOMINE. Cell color was determined by the best gene rank percentile for the analysis within the cells. The threshold is as following: P-value=1E-4, fold change=1.5, gene rank=top 10%. (B) HOXC6 expression was associated with OS (n=152, p=0.0139) according to Kaplan–Meier analysis from OncoLnc database. (C) The mRNA levels of HOXC6 from 14 normal brain tissue samples, 18 samples of low-grade glioblastoma tissue samples and 21 samples of high-grade glioblastoma tissue samples were tested by quantitative PCR using unpaired t-test. (D) Protein levels of HOXC6 in 6 paired glioblastoma tissues and its adjacent normal tissues by Western blotting. (E) HOXC6 mRNA expression levels in 5 GBM cell lines (A172, U251, U87, U118, LN229) and in 1 human astrocyte (NHA) were examined by quantitative PCR using t-test. (F) HOXC6 protein expression in 5 GBM cell lines (A172, U251, U87, U118, LN229) and in 1 human astrocyte (NHA) was examined by Western blotting. *p<0.05, **p<0.01, ***p<0.001.
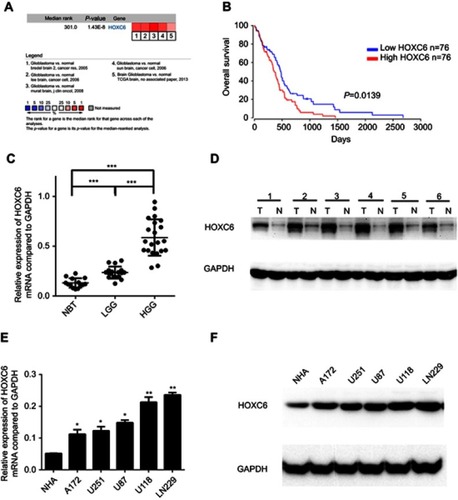
Figure 2 Upregulation of HOXC6 is associated with poor prognosis of patients with CBM. (A) H&E staining of HOXC6 protein expression in 14 normal brain tissue samples and 107 GBM tissues with anti-HOXC6 antibody. Two representative cases were shown. The scale bar of each figure is 50 μm. (B) Immunohistochemical staining of HOXC6 protein in 107 paired CBMs and their corresponding noncancerous tissues with anti-HOXC6 antibody. The scale bar of each figure is 50 μm. (C) HOXC6 overexpression was associated with OS (n=107, p=0.0243) and DFS (n=107, p=0.0013) according to Kaplan–Meier analysis.
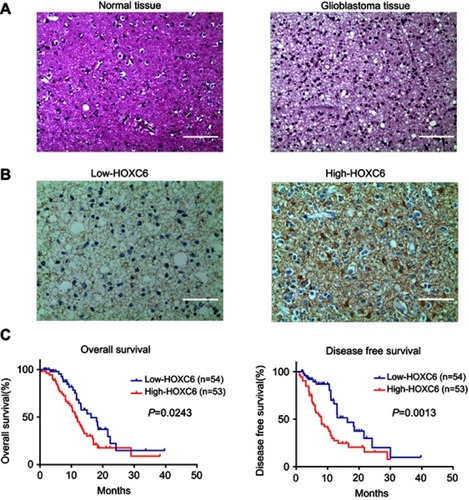
Figure 3 HOXC6 regulates the proliferation and clonogenicity of GBM cells. (A) The effect of HOXC6 knockdown with shRNA and shNC was verified by Western blotting 48 hrs after transfection. (B) The effect of HOXC6 overexpression was verified by Western blotting. (C) Viability of HOXC6 knockdown cells was assessed with a CCK-8 assay at indicated times. (D) Viability of HOXC6 overexpression cells was assessed with a CCK-8 assay at indicated times. (E) Colony formation assays of U251 and U87 cells infected with shNC or HOXC6-targeted shRNAs and the relative statistical analysis are shown by column diagram. (F) Colony formation assays of HOXC6 overexpression cell lines. All experiments were carried out in triplicate. Data are presented as mean ± standard deviation. Statistically significant difference: *p<0.05, **p<0.01, ***p<0.001.
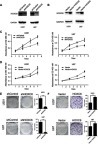
Figure 4 HOXC6 promotes GBM cells migration. (A) Wound healing assay of U251 and U87 cells infected with shNC or HOXC6-targeted shRNAs and the relative statistical analysis showed by column diagram. (B) Wound healing assay of U251 and U87 cells in HOXC-overexpressing and empty vector group, the relative statistical analysis is shown by column diagram. (C) Transwell assay of U251 and U87 cells infected with shNC or HOXC6-targeted shRNAs and the relative statistical analysis showed by column diagram. (D) Transwell assay of U251 and U87 cells in HOXC-overexpressing and empty vector group, relative statistical analysis shown by column diagram. All experiments were carried out in triplicate. Data are presented as mean ± standard deviation. Statistically significant difference: ***p<0.01.
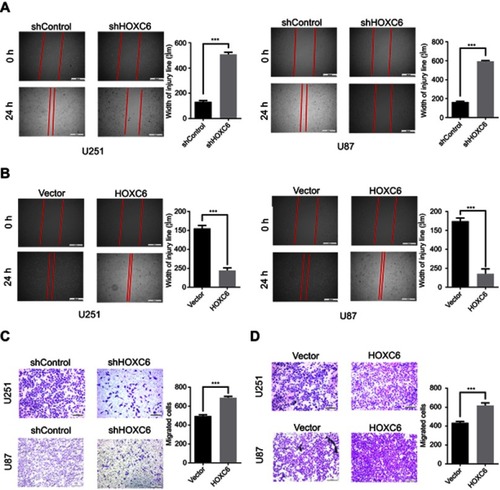
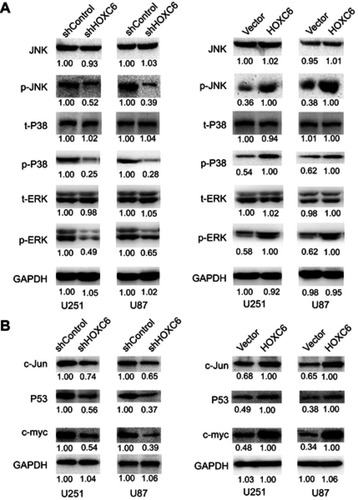
Figure 5 HOXC6 promotes cell proliferation and migration via activation of MAPK pathway. (A) Expressions of JNK (total), P38 (total), ERK (total), p-JNK, p-P38 and p-ERK were examined by Western blot assays in HOXC6 knockdown GBM cell models (left panel) and HOXC6 overexpression cell models (right panel). (B) Expressions of c-Jun, P53 and c-myc were examined by Western blot assays in HOXC6 knockdown GBM cell models (left panel) and HOXC6 overexpression cell models (right panel).