Figures & data
Table 1 Real-time PCR primers used in gene expression analysis
Figure 1 Construction of PDX1 overexpression in PANC-1 cells. (A) Scheme of the lentiviral construct used to obtain GFP-labeled PANC-1PDX1 (1) and PANC-1Control (2) cells. (B) Western blot analysis of the expression of the PDX1 protein in PANC-1PDX1 cells and in the PANC-1Control group, and the expression of PDX1 in PANC-1PDX1 after treatment with anti-PDX1 siRNA and negative siRNA. Abbreviations: PCNA - proliferating cell nuclear antigen gene promoter; PDX1 -Pancreatic And Duodenal Homeobox 1 gene; PGK - promoter of 3-phosphoglycerate kinase gene; puro - puromycin-resistance gene encoding N-acetyl-transferase; CMV - cytomegalovirus promoter; GFP - green fluorescent protein gene, 5'-LTR, 3'- LTR - 5' and 3' long terminal repeat; GAPDH - Glyceraldehyde 3-phosphate dehydrogenase; kDa - kilodalton.
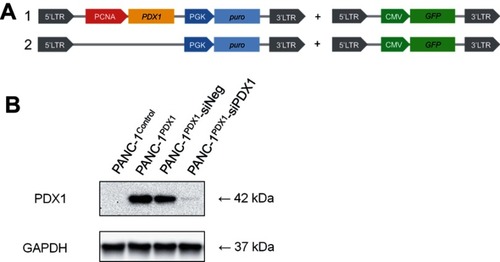
Figure 2 Effects of PDX1 overexpression on PANC-1 cell proliferation. (A) Growth curves of cells were plotted after transfection with indicated vectors by MTT assays. The OD value of cells in the control group was lower than that of PANC-1PDX1+ cells. *P<0.05, **P<0.01 compared with control group (B) Flow cytometry results showed that the number of cells in the S stage of PANC-1PDX1+ was significantly lower than of PANC1Control, whereas the number of cells in the G1 and G2 stages of PANC-1PDX1+ cells was higher than that of PANC1.Control
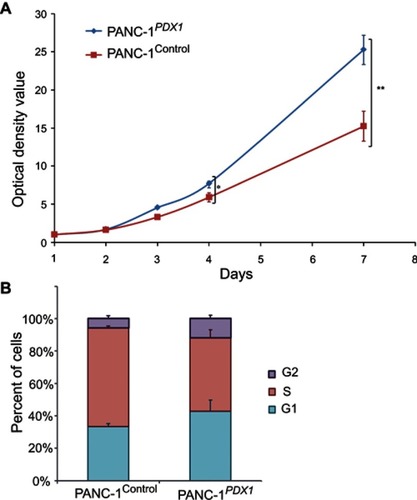
Figure 3 Expression of PDX1 significantly reduces both migration and invasion of human pancreatic cancer cells. (А) Effect of PDX1 overexpression on pancreatic cancer cell wound recovery. Nearly confluent cell monolayers of PANC-1Control and PANC-1PDX1 cells were scratched, and wound recovery was monitored after 24 hrs. The rate of wound closure ± SEM is shown. The experiment was performed in triplicate with a similar trend. (B) The transwell cell invasion assay of PANC-1Control and PANC-1PDX1 cells. Representative fields of invasive cells on a membrane are captured. The average number of invasive cells per field from three independent experiments ± SEM is shown. *P<0.05; **P<0.01.
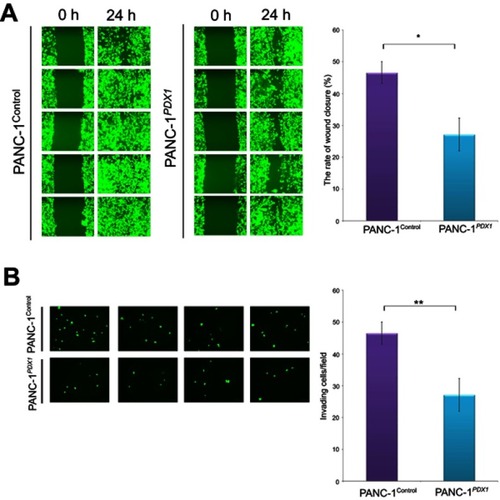
Figure 4 Relative expression of pro-epithelial and pro-mesenchymal genes in PANC1Control and PANC-1PDX1 cells. TFs are the transcription factors. Data are presented as the mean ± SEM for three to five independent experiments; *P<0.05, **P<0.01 compared with the control group.
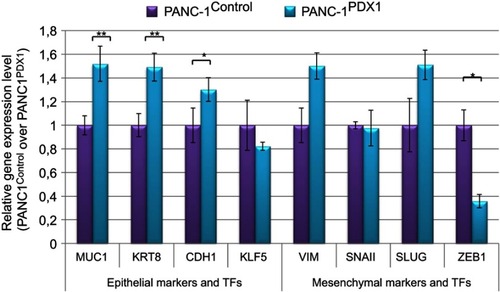
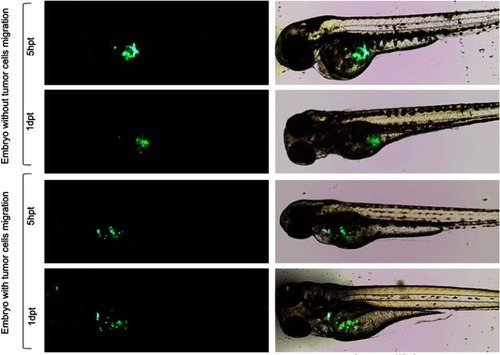
Table 2 Quantitation of embryos with migrating cellsa
Figure 5 Representative images of migration of PANC-1PDX1/PANC-1Control cells within injected embryos. Fluorescent (left) and bright/fluorescent fields (right) images are presented 20× magnification. hpt is hour post-transplantation, dpt is days post-transplantation.