
Figures & data
Figure 1 Sample processing and CTC detection. Blood mononuclear cells (BMCs) and CTCs were isolated by density gradient centrifugation (A). EpCAM+ and CD45- cells identified by flow cytometry were considered tumor cells (B). Cells from different regions were identified by laser confocal microscopy (EpCAM-APC: Red: CD45-Alexa Fluor® 488: Green) (C). Cells randomly isolated by flow cytometry from the EpCAM+ CD45- region and the EpCAM+CD45+ region of one specimen were manually separated by micropipetting under a microscope, after which individual cells were subjected to whole-genome amplification to detect copy number variation (CNV) profiles. The copy numbers are segmented (blue and red lines) (D).
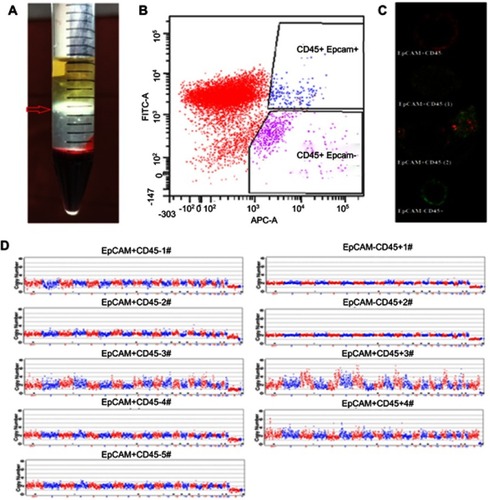
Table 1 Univariate analysis of the predictors in 39 patients with periampullary or pancreatic cancer after operation
Figure 2 Kaplan-Meier curve of metastasis and disease-free survival in all patients (pancreatic and periampullary tumors) based on a portal EpCAM+CD45- percentage cutoff of ≥24.5×10⁻⁴ vs <24.5×10⁻⁴ and a portal EpCAM+CD45- count cutoff of ≥60/5 mL vs <60/5 mL.
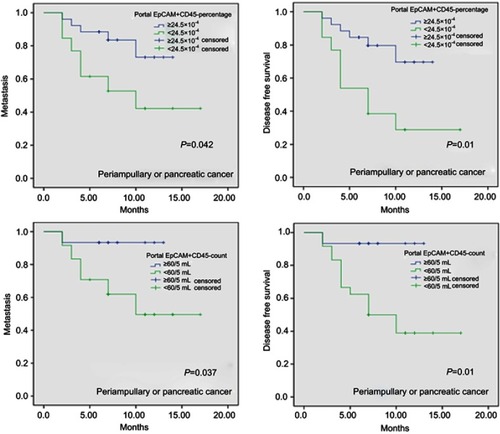
Table 2 Univariate analysis of the predictors in 24 patients with pancreatic cancer after operation
Figure 3 Kaplan-Meier curve of metastasis- and disease-free survival in pancreatic cancer based on a portal EpCAM+CD45- percentage cutoff of ≥24.5×10⁻⁴ vs <24.5×10⁻⁴ and based on a portal EpCAM+CD45- count cutoff of ≥60/5 mL vs <60/5 mL.
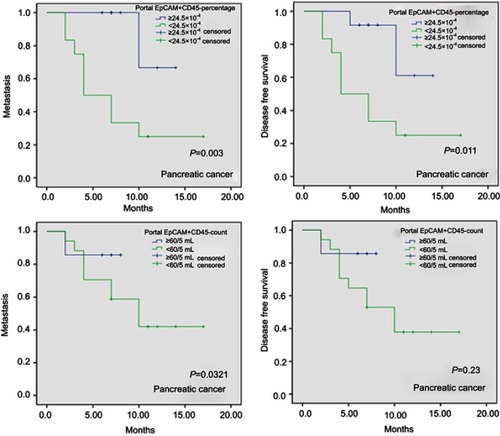
Figure 4 CTCs in the blood of patients with pancreatic or periampullary tumors and relationship with tumor metastasis. Tumor cells from the primary tumor first enter the portal vein in the form of a single cell or small emboli and easily migrate to the liver, causing metastasis; a smaller number of CTCs can migrate to the lung, bone or brain and cause metastatic cancer. Only a few tumor cells appear in the peripheral blood.
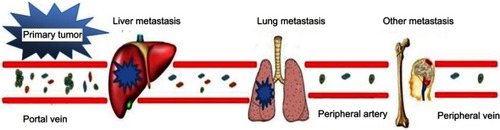
Figure S1 (A) EpCAM+ cells meeting the morphological criteria were identified as CTCs (Hoechst: blue; EpCAM-FITC: green); (B) CD45- cells meeting the morphological criteria were identified as CTCs (Hoechst: blue; CD45-PE: red).
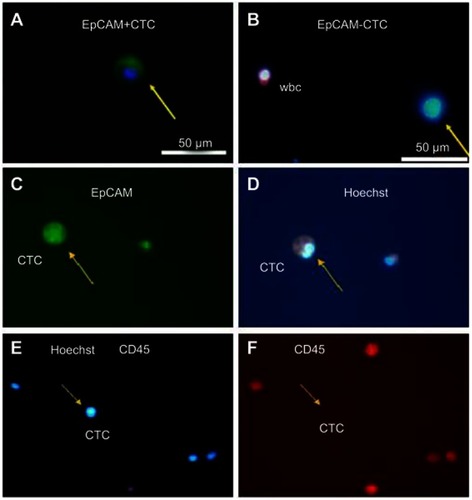
Figure S2 CNVs in CTCs and WBCs from two pancreatic cancer patients (sample 1 and sample 2). The CNV patterns of CTCs in both sample 1 and sample 2 are significantly different from those of WBCs. The copy numbers are segmented (blue and red lines).
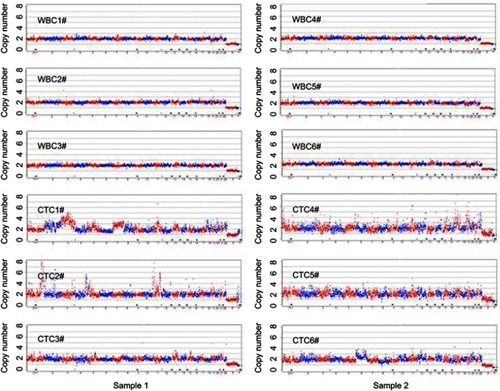
Figure S3 Cutoff point of FCM parameters defined using maximally selected log-rank statistics for disease-free survival in periampullary and pancreatic tumor patients. Maximally selected log-rank statistics were used to define possible cutoff points for FCM parameters. Four FCM parameters were found to be associated with DFS in all patients (portal EpCAM+CD45- count, P=0.024 for a cutoff of 59/5 mL; portal EpCAM+CD45- percentage, P=0.018 for a cutoff of 4.2×10⁻⁴; peripheral EpCAM+CD45- count, P=0.03 for a cutoff of 96/5 mL; and peripheral EpCAM+CD45- percentage P=0.015 for a cutoff of 12.86×10⁻⁴). The cutoff points were then adjusted according to participant distribution into two groups for all patients (60/5 mL, 24.5×10⁻⁴) as well as for pancreatic cancer patients (97/5 mL, 4.4×10⁻⁴).
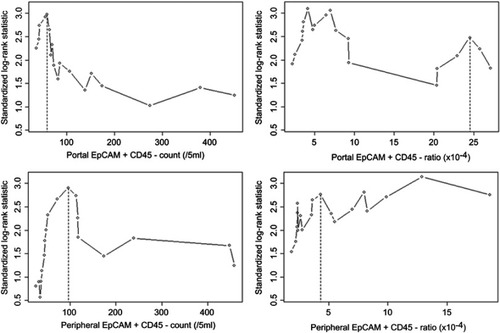
Table S1 Patient and tumor characteristics
Table S2 Detection Results of CVN of CTCs based on single-cell sequencing