Figures & data
Figure 1 Expressions of ADAR1 in AML patients and the control subjects. (A) The mRNA levels of ADAR1 in AML patients and control subjects were measured by qPCR . (B) The relationship between the levels of ADAR1 mRNA and the ratio of leukemic cells. (C) Representative pictures of three independent experiments that gave similar results were shown. (D) Summarized data of Western blots of the levels of ADAR1 protein in AML patient and control group. Data were shown as mean ± S.E.M. *P<0.05. **r=0.432, P<0.001 Spearman correlation analysis.
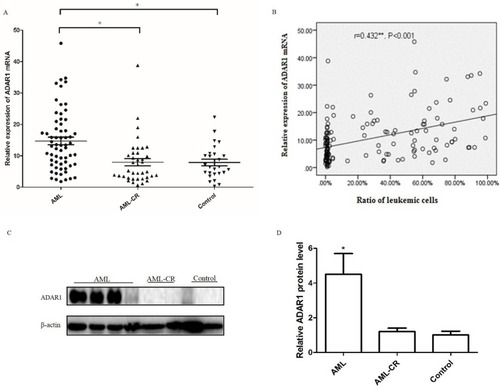
Figure 2 Silence of ADAR1 in AML cell line inhibits the proliferation of K562 cells. (A) The transfection efficiency of adenoviral vectors were measured by qPCR. (B) The transfection efficiency of adenoviral vectors were measured by Western Blot. (C) The effects of ADAR1 knockdown on cell proliferation in K562 cells measured by MTT assay. (D) The effects of ADAR1 knockdown on colony formation capacity of K562 cells. The same amounts of related cells were plated into a 6-well plate. Cell colonies were stained and counted after two weeks. (E) Summarized data of the colony formation assay. (F) The effects of ADAR1 knockdown on cell cycle of K562 cells measured by flow-cytometry assay. (G) Summarized data of the cell cycle analysis. All the above experiments were repeated at least three times. The data represents mean ± SD of three independent experiments. *P<0.05.
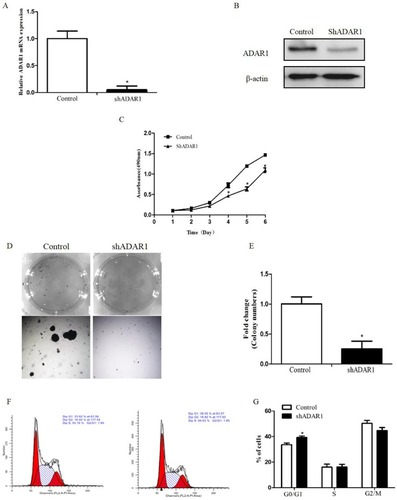
Figure 3 Silence of ADAR1 inhibits the expressions of Wnt effectors. (A) The effect of ADAR1 knockdown on the expressions of Wnt effectors measured by qPCR. (B) The effect of ADAR1 knockdown on the expressions of Wnt effectors measured by Western Blot. All the above experiments were repeated at least three times. The data represents mean ± SD of three independent experiments. *P<0.05.
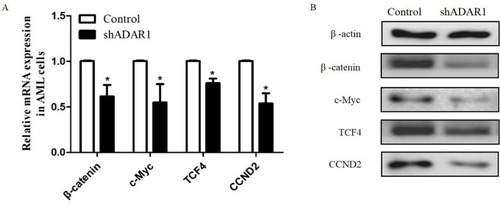
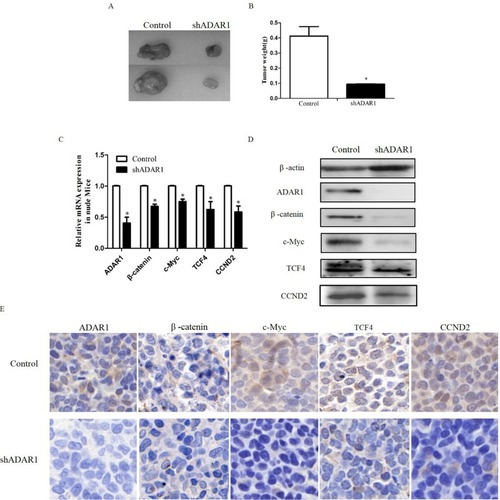
Figure 4 Silence the ADAR1 inhibits AML proliferation and Wnt pathway in vivo. (A) The effects of ADAR1 knockdown on cell proliferation in K562 cells in vivo. (B) Summarized data of the tumor weight. (C) The effect of ADAR1 knockdown on the expressions of Wnt effectors measured by qPCR in vivo. (D) The effect of ADAR1 knockdown on the expressions of Wnt effectors measured by Western Blot in vivo. (E) The effect of ADAR1 knockdown on the expressions of Wnt effectors measured by Immunohistochemical staining. All the above experiments were repeated at least three times. The data represents mean ± SD of three independent experiments. *P<0.05.