Figures & data
Table 1 PCR primers used in this study
Figure 1 Negative effect of metformin on DEC1 expression in HeLa cells. HeLa cells were treated with (A) the indicated concentrations of metformin for 16 h; with (B) the indicated concentrations of metformin for 5 h plus 10 μM MG132 for 3 h; or with (C) 50 μg/mL CHX for indicated times. Cell lysates were subject to Western blot analysis using antibodies against AMPKα, p-AMPKα, ACC, p-ACC, FASN and DEC-1; ACTN served as the loading control. (D) HeLa cells were transiently transfected with the indicated amounts of pEGFP.DEC1 or 1 μg of empty pEGFP vector (control) and treated with 3 mM metformin for 20 h. Cell lysates were subjected to Western blot analysis using antibodies against DEC1, PARP and survivin; PCNA was the loading control. The results are representative of two independent experiments.
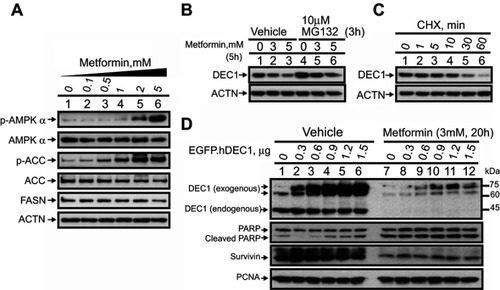
Figure 2 Factors modulating DEC1 expression in HeLa cells. HeLa cells were transiently transfected with 0.5 μg of (A) DEC1 promoter or (B) p21 promoter and the indicated amounts of p53 plus 0.5 μg mZac1 vector. (C–E) HeLa cells were transiently transfected for 16 h with 0.5 μg of DEC1 promoter and: (C) 0.25 μg of the indicated p53 fragment; (D) p53 (R175H) plus 0.5 μg of mZac1; or (E) wild-type (wt) HDAC1, enzyme-dead (H141A) HDAC1, or SV40-LT, with or without 0.3 μM TSA. Cells were then cultured for 36 h and harvested for luciferase reporter assays. Data are averages of three experiments (mean ± SD; n=3). (F) HeLa cells were treated with 0.3 μM TSA for 16 h, after which cell lysates were subjected to Western blot analysis using antibodies against p53, DEC1, and acetylated histone H3; PCNA was the loading control. The results are representative of three independent experiments.
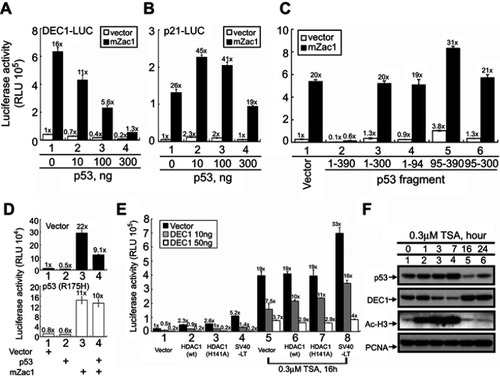
Figure 3 The functions DEC1 in transcriptional regulation. (A and B) HeLa cells were transiently transfected with the indicated amount of pFlag.DEC1. Cell lysates were then subjected to (A) Western blot analysis using antibodies against DEC1, p53, p21, cyclin D1, and survivin; or (B) RT-PCR analysis of DEC1, p53, p21, and cyclin D1. ACTN was the protein loading control, and GAPDH was the mRNA loading control. (C) DEC1 was knocked down (shDEC1) in HeLa cells, after which the cells were subjected to RT-PCR analysis of DEC1, p53, p21, and cyclin D1. Protein and PCR bands (A-C) were quantified through pixel density scanning and evaluated using ImageJ, version 1.44a (http://imagej.nih.gov/ij/). The fold was normalized to the internal control for the protein or gene. (D and E) HeLa cells were transiently transfected with 0.5 μg of DEC1 promoter, pGL3 reporter, and the indicated amount of p53. Plotted are the concentration-dependent effects of DEC-1 on (D) the relative level of reporter activity and (E) the DEC1-to-pGL3 reporter activity ratio. (F and G) HeLa cells were transiently transfected with 0.5 μg DEC1 promoter and indicated amounts of (F) DEC1 or (G) SIRT1. Cells were cultured for 36 h and harvested for luciferase reporter assays. Data are averages of three experiments (mean ± SD; n=3). **p<0.01, and ***p<0.005 (Student’s t-test).
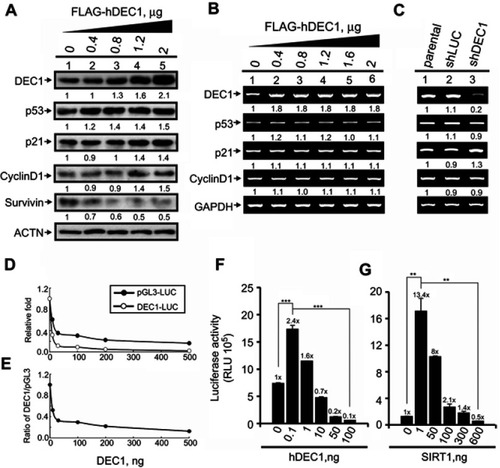
Figure 4 Cross-talk between phenformin and DEC1 in HeLa and A2058 cells. (A and B) HeLa cells were treated for 16 h with the indicated concentration of phenformin. Cell lysates were then subjected to (A) RT-PCR or (B) Western blot analysis of p53, p21, DEC1, and survivin. GAPDH was the mRNA loading control, while ACTN was the protein loading control. PCR and protein bands (A and B) were quantified through pixel density scanning and evaluated using ImageJ. The fold was normalized to the control for the gene or protein. (C and D) DEC1 was knocked down in (C) HeLa and (D) A2058 cells, which were then treated for 16 h with the indicated concentration of phenformin. Cell lysates were subjected to Western blot analysis using antibodies against p53, survivin, cyclin D1, and DEC1. PCNA was the protein loading control. Protein bands (C and D) were quantified through pixel density scanning and evaluated using ImageJ. The fold was compared with shLUC, normalized to the internal control protein PCNA. The results are representative of three independent experiments.
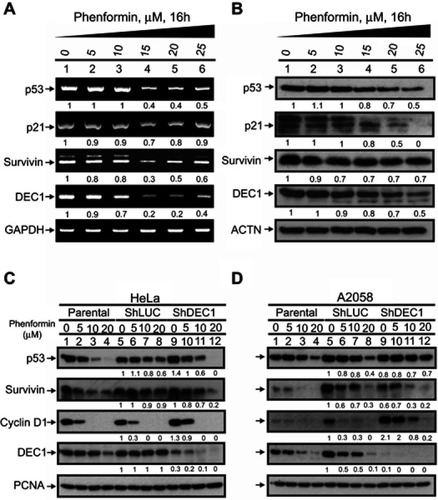
Figure 5 Effects of phenformin and DEC1 on the cell cycle profile of HeLa and A2058 cells. DEC1 was knocked down in (A) HeLa and (B) A2058 cells, which were then treated for 30 h with the indicated concentration of phenformin. Cell lysates were subjected to cell cycle profiling using flow cytometry. The results are representative of two independent experiments.
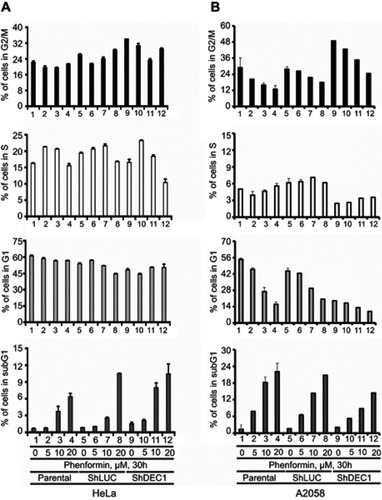
Figure 6 Effects of phenformin and DEC1 on the OCR in A2058 cells. DEC1 was knocked down in A2058 cells, which were then treated for 16 h with 10 μM phenformin. The cellular OCR was measured using an XF24 bio-energetic assay. The results are representative of three independent experiments. *p<0.05 and **p<0.01 (Student’s t-test).
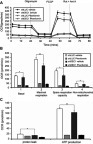
Figure 7 Effects of phenformin and DEC1 on colony formation and anchorage-independent growth of A2058 cells. DEC1 was knocked down in A2058 cells, which were then treated with indicated concentration of phenformin for (A) 10 days (the colony formation) or (B) 20 days (the anchorage-independent growth). The results are representative of two independent experiments. #p>0.05, *p<0.05, **p<0.01, and ***p<0.005 (Student’s t-test).
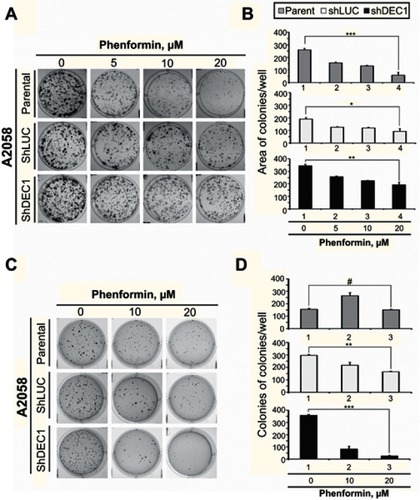
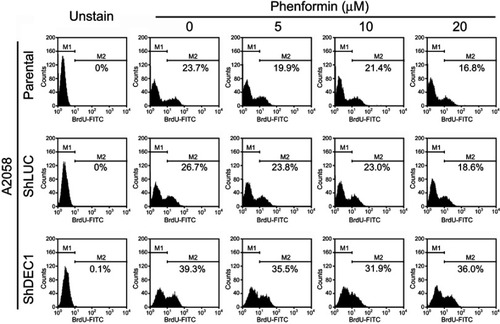
Figure 8 Effects of phenformin and DEC1 on proliferation of A2058 cells. DEC1 was knocked down in A2058 cells, which were then treated for 16 h with the indicated concentration of phenformin. Cell proliferation measured was measured based on BrdU incorporation using flow cytometry. The results are representative of three independent experiments.