
Figures & data
Figure 1 Expression of EpCAM and FRα in A2780 cells and identification of synthesized MNs. (A) Flow cytometry detection of epithelial cell adhesion molecule (EpCAM) and folate receptor alpha (FRα) expression in A2780 cells. A2780 cells were stained with anti-EpCAM (blue) and anti-FRα antibodies (red) and the negative control was autofluorescent (orange). (B) Immunofluorescence detection of EpCAM and FRα expression in A2780 cells. EpCAM and FRα stained with Alexa Fluor® 488 are green at an excitation wavelength of 488 nm, and nuclei stained with DAPI are blue at an excitation wavelength of 405 nm. (C) Identification of synthesized magnetic nanospheres. The Alexa Fluor 488-conjugated donkey anti-mouse IgG (H + L) secondary antibody specifically bound to antibody-modified magnetic beads (green).
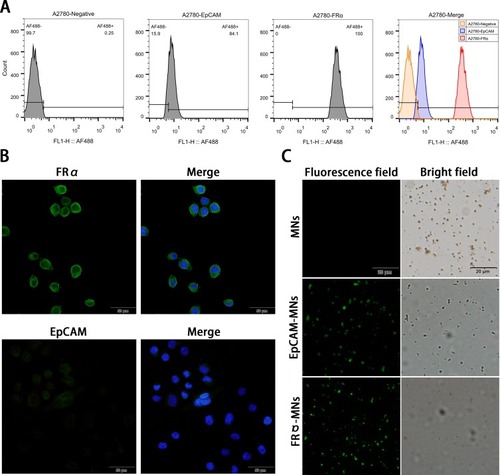
Figure 2 Efficiencies of anti-EpCAM-MNs and anti-FRα-MNs used alone or in combination to capture target cells. (A) Capture efficiencies of using anti-EpCAM-MNs alone, anti-FRα-MNs alone, or a combination of both to capture A2780 cells in PBS, lysed blood, and whole blood, and unmodified MNs served as a negative control. (B) Capture efficiencies of using anti-EpCAM-MNs alone, anti-FRα-MNs alone, or a combination of both for capturing A2780 cells (), MCF7 cells (
), A549 cells (
), and Jurkat T-cells (
). (C) Capture efficiencies of anti-EpCAM-MNs (light gray), anti-FRα-MNs (dark gray), combination of anti-EpCAM-MNs and anti-FRα-MNs (white), and unmodified MNs (black) to capture A2780, MCF7, or a mixture of A2780 and MCF7 cells. (D, E, F) The regression analysis plots of recovered vs spiked A2780 cells detected using anti-EpCAM-MNs (D), anti-FRα-MNs (E), and a combination of anti-EpCAM-MNs and anti-FRα-MNs (F). (G) Three-color ICC identified the capture cells. CTCs were CK19-positive (red), DAPI-positive (blue), and CD45-negative (green). (H) Fluorescence microscopic image of the captured cells stained with calcein-AM (green) and propidium iodide (red). (I) Bright field photograph of the captured cells shows that the cells remain intact (arrows). Each experiment was repeated three times. *P < 0.05.
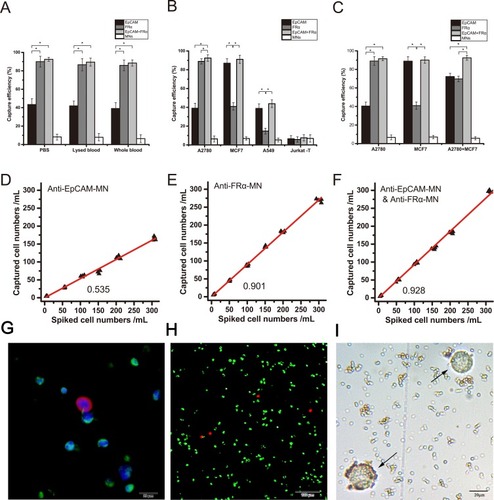
Table 1 Patient Characteristics
Table 2 Paired Chi-Square Test Of The Positive Rate When Using Anti-EpCAM-MNs Alone And That When Using A Combination Of Anti-EpCAM-MNs And Anti-FR-MNs In 95 Blood Samples From 30 Patients With Epithelial Ovarian Cancer
Figure 3 CTC detection in peripheral blood samples from patients with EOC. (A) CTC levels in 95 blood samples from 30 patients with EOC and 20 patients with benign disease as identified using anti-EpCAM-MNs alone or a combination of anti-EpCAM-MNs and anti-FRα-MNs. (B) Paired comparison shows the number of CTCs detected using anti-EpCAM-MNs alone or a combination of anti-EpCAM-MNs and anti-FRα-MN. (C) Fluorescence microscopic images of cells isolated from patients with EOC and identified using three-color immunofluorescence staining. The cells were stained with Alexa Fluor® 568-labeled anti-CK19 monoclonal antibody (red), Alexa Fluor 488-labeled anti-CD45 monoclonal antibody (green), and DAPI (blue). The Cytokeratin 19 (CK19)-positive (red), DAPI-positive (blue), and CD45-negative cells (green) indicated by the arrows were enumerated as CTCs. ****P < 0.0001.
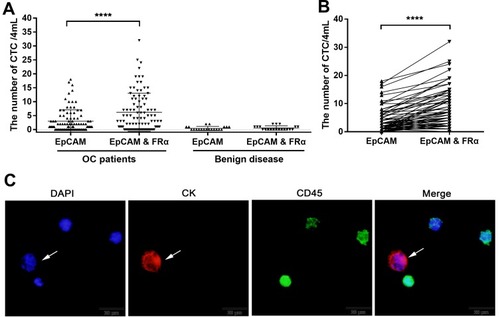
Table 3 Sensitivity And Specificity In 28 Patients With Initially Diagnosed Epithelial Ovarian Cancer And 20 Patients With Benign Disease