Figures & data
Table 1 Clinical Characteristics According To Electrolyte Abnormalities
Table 2 Univariate Analysis And Multivariate Analysis Of The Risk Of Postoperative Complication
Figure 1 Kaplan–Meier curve for overall survival (OS) in patients with hyponatremia or hypocalcemia and those without.
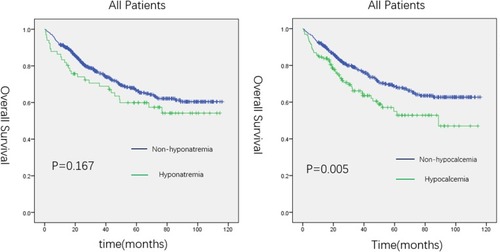
Table 3 Univariate Analysis And Multivariate Analysis Of The Risk Of Postoperative Complication In Young Patients And Elderly Patients
Table 4 COX Regression Analysis Of The Relationship Between OS And Electrolyte Abnormalities Or Patient Characteristics In Young Patients And Elderly Patients
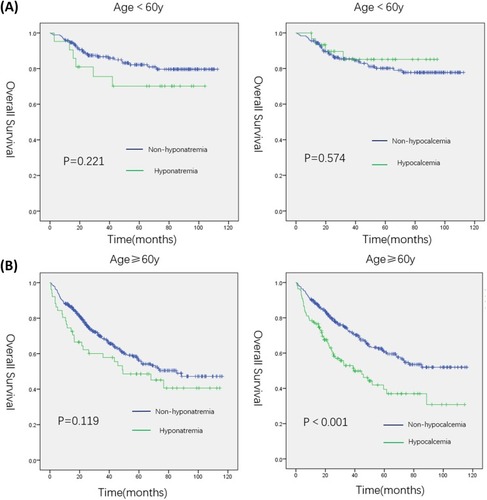
Figure 2 Kaplan–Meier curves. (A) Kaplan–Meier curve for overall survival (OS) in younger patients with hyponatremia or hypocalcemia and those without. (B) Kaplan–Meier curve for overall survival (OS) in elderly patients with hyponatremia or hypocalcemia and those without.