
Figures & data
Figure 1 Flow chart of patient selection.
Abbreviations: RCC, renal cell carcinoma; pRCC, papillary renal cell carcinoma; NLR, neutrophil-to-lymphocyte ratio.
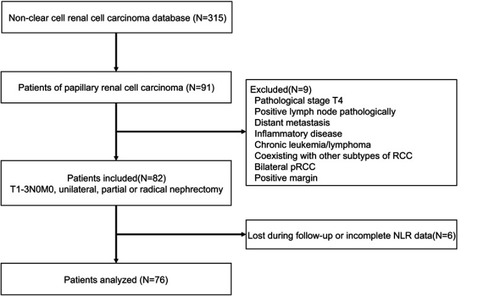
Table 1 Demographic and clinicopathologic characteristics of patients with non-metastatic pRCC after partial or radical nephrectomy
Table 2 Univariate and multivariate Cox regression models to predict DFS for patients of non-metastatic pRCC (T1-3N0M0)
Figure 2 Kaplan-Meier curves and log-rank test showing patients with high NLR level (≥2.5) had worse DFS compared with those with low NLR level (<2.5) (p=0.03).
Abbreviations: NLR, neutrophil-to-lymphocyte ratio; DFS, disease-free survival.
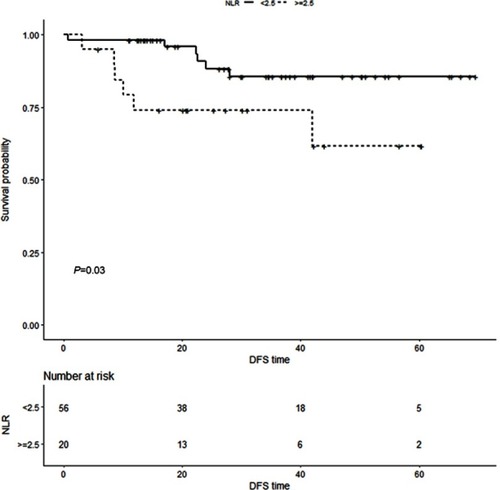
Table S1 Patient characteristics who recurred following curative surgery