Figures & data
Figure 1 LRP11 expression in normal and cervical cancer tissues. (A) Protein expression of LRP11 was determined by Western blotting in 12 normal cervical tissues and 12 tumor tissues. (B) Quantification of protein expression levels as shown in A. *P<0.05.
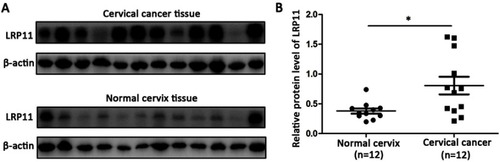
Figure 2 Expression of LRP11 and P16 in cervical cancer tissues and their correlation. (A and B) The expression of P16 and LRP11 in normal cervix, high squamous intraepithelial lesion (HSIL) and cervical cancer tissues (×40 and ×200). (C and D) The H-Score of P16 and LRP11 in normal cervix, HSIL and cervical cancer. (E) The correlations between expression of P16 and LRP11. ***P<0.001.
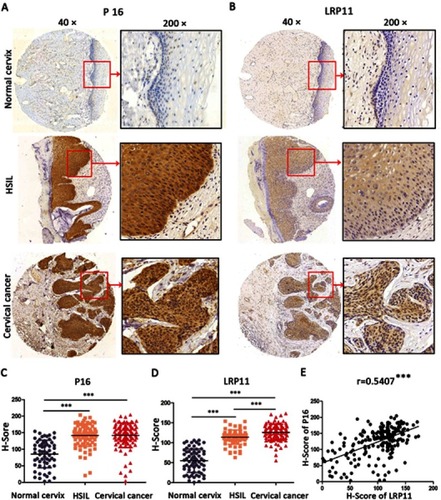
Table 1 Association between LRP11/P16 expression and clinicopathological factors
Figure 3 Kaplan-Meier overall survival (OS) curve for cervical cancer patients and the correlation of OS with P16 expression (A) and LRP11 expression (B). *P<0.05.
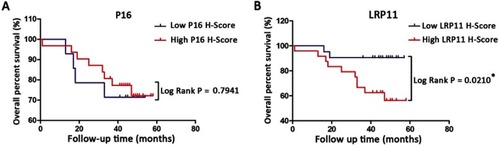
Figure 4 The effect of LRP11 silencing on P16. (A) The protein levels of LRP11 and P16 were determined by Western blotting in SiHa, as well as quantification of protein expression levels (B) CaSki protein levels, similar to that of SiHa. *P<0.05, **P<0.01, compared with the NC groups.
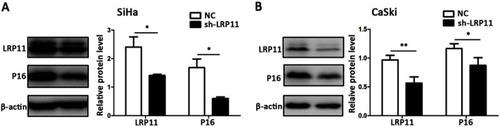
Figure 5 Effect of LRP11 on cell viability and cell cycle distribution. (A and B) After 0, 12, 24, 48, 72 h, viabilities of the SiHa and CaSki cell lines were assessed using the CCK-8 assay. (C and D) Cell cycle distributions of cells transfected with shRNA and their NC groups were assessed by flow cytometry. (E and F) Cell cycle phase distribution was expressed as the percentage of total cells as shown in C and D. (G and H) After shRNA transfection, the protein expression levels of CDK 2-cyclin E1 and CDK 4-cyclin D1 were determined and analyzed by Western blotting. *P<0.05, **P<0.01, ***P<0.001 compared with the NC groups.
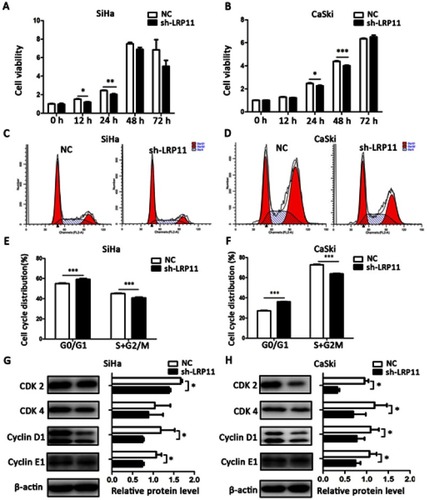
Figure 6 Effect of LRP11 on apoptosis. (A) Knockdown of LRP11 by shRNA induced early apoptosis of sh-LRP11 SiHa cells. (B) Knockdown of LRP11 by shRNA induced no change of apoptosis in CaSki cells. (C and D) Quantification of A and B. (E and F) After shRNA transfection, protein expression levels of cleaved PARP, Bcl-xL and Bax were analyzed by Western blotting. *P<0.05 compared with the NC groups.
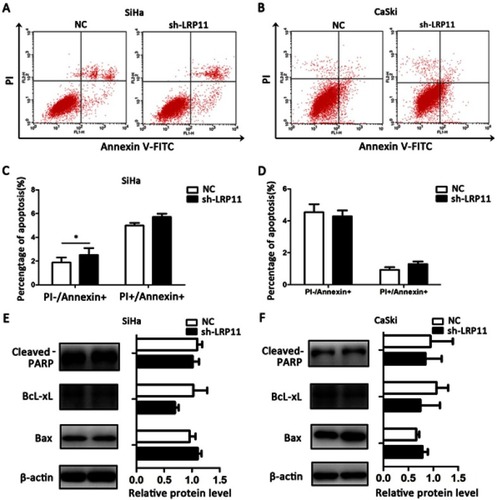
Figure 7 Effect of LRP11 on migration and invasion of SiHa and CaSki cells. (A and B) Silencing LRP11 in SiHa and CaSki cells resulted in decreased migration and invasion. (C and D) Quantification of the images of A and B. (E and F) Western blotting was performed to identify the protein levels of MMP-2, MMP-9 and VEGF after the silencing LRP11 in the SiHa and CaSki cells; *P<0.05, **P<0.01, ***P<0.001 compared with the NC groups.
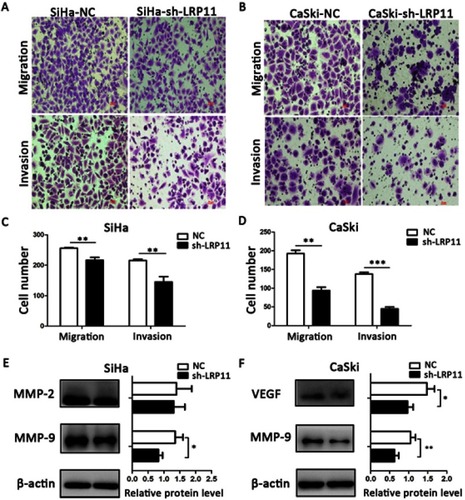
Figure 8 Effect of LRP11 sh-RNA on tumor growth in vivo. SiHa cells transduced with sh-LRP11 were subcutaneously injected into nude mice. (A and B) Tumor volumes were measured for 41 days. (C and D) At day 41, nude mice were sacrificed and the tumors were weighed. (E) LRP11 and P16 expression of the tumor in vivo by IHC. (F) H-Score of LRP11 and P16 in image E. *P<0.05, ***P<0.001 compared with the NC groups.
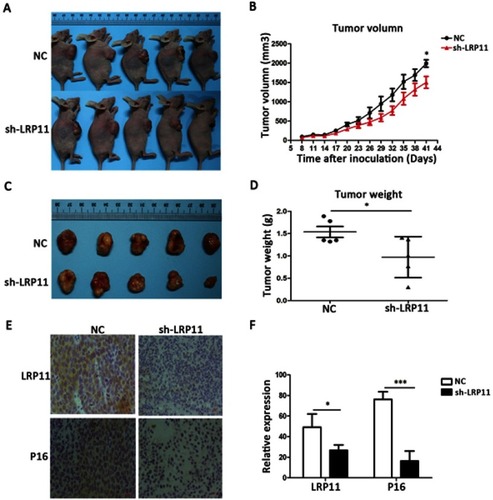
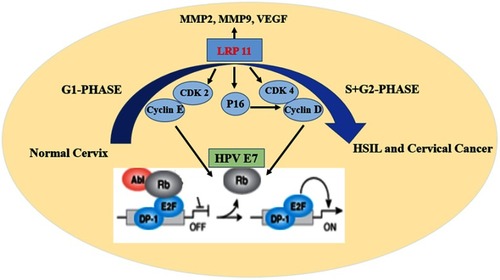
Figure 9 Schematic model of the effect of LRP11 on cervical cancer cells.