
Figures & data
Table 1 Clinical characteristics of patients in the development cohort and training cohort
Figure 1 The flowchart of the study cohort.
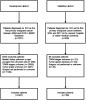
Table 2 Cumulative OS and CSS in patients with surgically resected ICC
Table 3 Univariate and multivariate COX regression analyzes for OS in patients with surgically resected ICC
Table 4 Univariate and multivariate competing risk analyzes for CSS in patients with surgically resected ICC
Table 5 Comparisons of c-indices between the nomograms and AJCC 8th edition TNM staging system in patients with surgically resected ICC
Figure 2 Nomograms predicting 1-, 3- and 5-year OS (A) and CSS (B) in patients with ICC after surgery. Each subtype within these variables was assigned a score on the point scale. By summing up the total score and locating it on the total point scale, we could draw a vertical line down to get the nomogram-predicted probability at each time point.
Abbreviations: CSS, cancer-specific survival; ICC, intrahepatic cholangiocarcinoma; LNR, lymph node ratio; OS, overall survival.
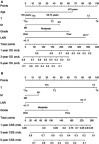
Figure 3 Calibration curves of the nomogram predicting OS in the development cohort: (A) 1-year OS; (B) 3-year OS; (C) 5-year OS. OS: overall survival.
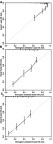
Figure 4 Calibration curves of the nomogram predicting OS in the training cohort: (A) 1-year OS; (B) 3-year OS; (C) 5-year OS.
Abbreviation: OS, overall survival.
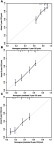
Figure 5 Calibration curves of the nomogram predicting CSS in the development cohort: (A) 1-year CSS; (B) 3-year CSS; (C) 5-year CSS.
Abbreviation: CSS, cancer-specific survival.
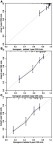
Figure 6 Calibration curves of the nomogram predicting CSS in the training cohort: (A) 1-year CSS; (B) 3-year CSS; (C) 5-year CSS.
Abbreviation: CSS, cancer-specific survival.
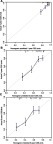
Figure 7 Decision curve analysis of nomograms and AJCC 8th edition staging system for predicting (A) 1-year OS; (B) 3-year OS; (C) 5-year OS. The grey line indicates the assumption that all patients die. The black line indicates that the assumption that all patients survive.
Abbreviation: OS, overall survival.
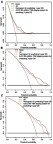
Figure 8 Decision curve analysis of nomograms and AJCC 8th edition staging system for predicting (A) 1-year CSS; (B) 3-year CSS; (C) 5-year CSS. The grey line indicates the assumption that all patients die. The black line indicates that the assumption that all patients survive.
Abbreviation: CSS: cancer-specific survival.
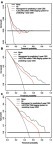
Figure S1 Kaplan–Meier cumulative OS curves in patients with ICC after surgery stratified by the clinical characteristics (A) gender; (B) age; (C) T stage; (D) N stage; (E) M stage; (F) LNR; (G) grade; (H) tumor size.
Abbreviations: OS, overall survival; ICC, intrahepatic cholangiocarcinoma; LNR, lymph node ratio.
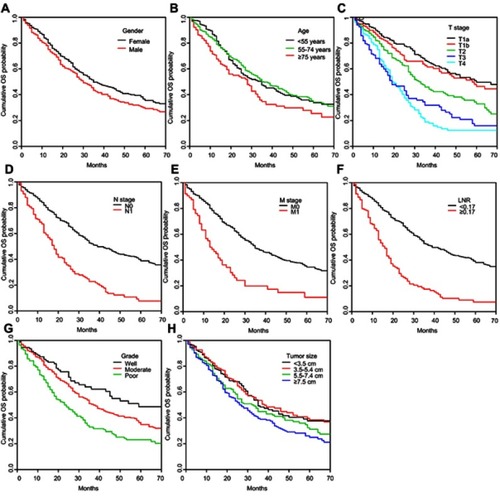
Figure S2 Cumulative CSS in patients with ICC after surgery stratified by the clinical characteristics: (A) T stage; (B) N stage; (C) M stage; (D) LNR; (E) grade; (F) tumor size.
Abbreviations: ICC, intrahepatic cholangiocarcinoma; LNR, lymph node ratio; CSS, cancer cancer-specific survival.
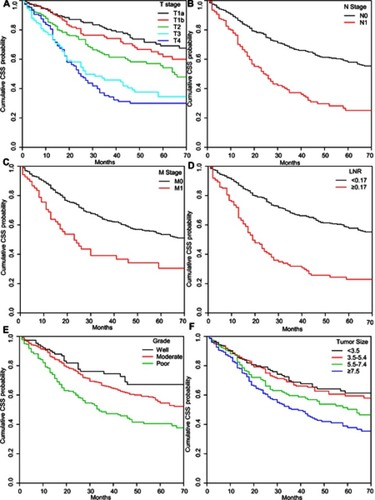
Figure S3 Cumulative non-cancer specific survival in patients with ICC after surgery stratified by the clinical characteristics (A) gender; (B) age.
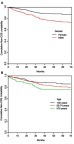
Table S1 Cumulative non-CSS in patients with surgically resected ICC