Figures & data
Figure 1 Images of esophageal squamous epithelial neoplastic lesions after iodine staining. (A) A schematic drawing of the worm-eaten boundary of an iodine-unstained area (irregular type). (B) A lesion with an irregular type of boundary of an iodine-unstained area. (C) A schematic drawing of the smooth boundary of an iodine-unstained area (regular type). (D) A lesion with a regular type and a well-demarcated boundary of an iodine-unstained area.
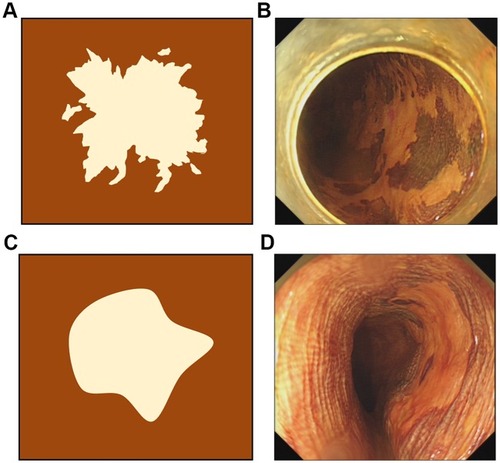
Figure 2 Images of endoscopic submucosal resection specimens stained by Lugol dye solution. (A) A lesion with more than five stained spots (marked by white circles), which were independently scattered in the iodine-unstained area, without connection to the surrounding iodine-stained area, was defined as positive for multiple stained spots in an iodine-free area. (B) A lesion with less than five scattered, deep-stained spots in the iodine-unstained area; negative for multiple stains in the iodine-free area.
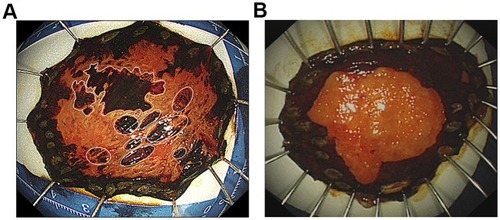
Table 1 The clinicopathological features of 32 patients with a BLSCC component
Figure 3 The invasive growth patterns and Ki-67 immunohistological findings of BLSCC components. (A) The BLSCC component presented with an infiltrative growth pattern, INFa, toward the LPM. (B) The BLSCC component exhibited INFb with minimal tumor foci in the LPM. (C) Ki-67 positive cells were mainly detected in the lower half of the epithelial layer of BLSCC components.
Abbreviations: LPM, lamina propria mucosae; INF, infiltration growth pattern.
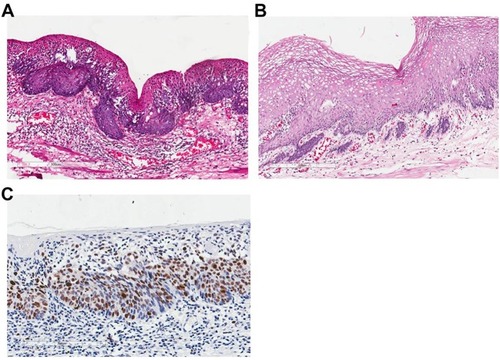
Table 2 Comparison between BLSCC and typical SCC groups, n (%)
Figure 4 The NBI images of BLSCC. (A) Endoscopic image under NBI showed the lesion with brownish color change. (B) A magnified view of the white box area in Figure A. The IPCLs exhibited the changes of dilatation, meandering, irregular caliber, and form variation, belonging to JES type B1.
Abbreviations: NBI, narrow-band imaging; IPCL, intraepithelial papillary capillary loop; JES, Japan Esophageal Society.
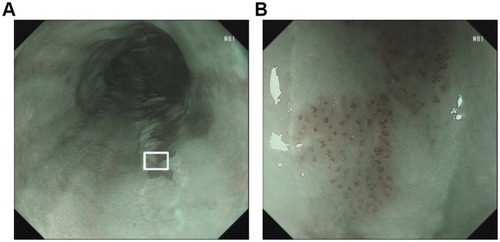
Table 3 Multivariate analysis of variables associated with the presence of BLSCC components
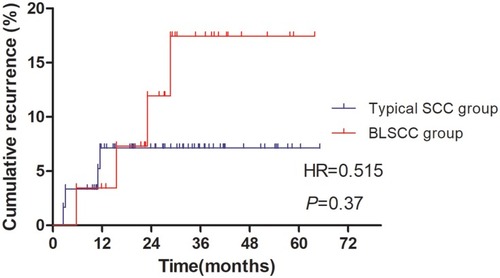
Figure 5 Comparison of cumulative recurrence rates between BLSCC group and typical SCC group.