Figures & data
Figure 1 Statins, both simvastatin (Sim) and fluvastatin (Flu) produce dose- and time-dependent inhibitions of cell proliferation and colony formation in PC3 cells. (A and B) show the time- and dose-dependent inhibition of cell proliferation by simvastatin (A) and fluvastatin (B). The experiment was performed as described in the Materials and Methods and cell proliferation was measured using MTS assay. Results are expressed as a percentage of vehicle-treated control, and the data are the mean ± SEM (n=3) of three independent experiments. (C) shows representative images of colony formation assay and (D and E) are the mean ± SEM (n=3) of three independent experiments of quantitative colony formation assays following simvastatin (D) and fluvastatin (E) treatment. *p<0.05 compared to corresponding vehicle-treated controls.
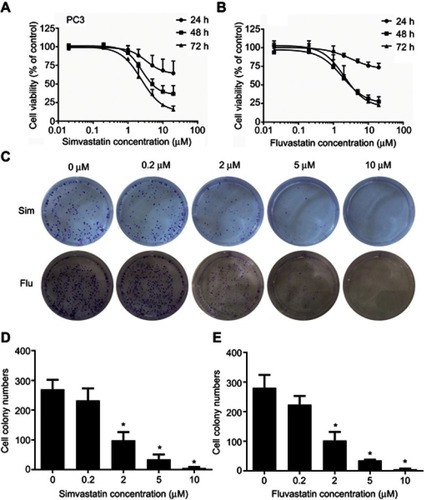
Figure 2 Statins, simvastatin (Sim) and fluvastatin (Flu) promote cell apoptosis in PC3 cells. (A and B) show representative images of Hoechst 33358 staining of cells treated with or without simvastatin (A) or fluvastatin (B). PC3 cells were treated for 48 h with the indicated concentrations of simvastatin or fluvastatin, stained with Hoechst 33358, and photographed with a fluorescence microscope using a blue filter at ×200 magnification. (C–F) show representative dot plots (C and D) and quantitation of apoptotic rates (E and F) of Annexin V-FITC apoptotic assay in PC3 cells following the treatment with various doses of simvastatin or fluvastatin, respectively. The apoptotic rate (%) is the sum of late (Q2) and early (Q3) apoptotic cells. The experiment was performed in triplicate, and the data are expressed as the mean ± SEM (n=3) of three independent experiments. Panels G-J show the time (G and I) and dose-dependent (H and J) induction of caspase 3 activity by simvastatin (G and H) or fluvastatin (I and J) treatment in PC3 cells assayed as described in the Methods and materials. The caspase 3 activity was presented as a percentage of corresponding vehicle control and the data are the mean ± SEM (n=3) of three independent experiments. *p<0.05 compared to the corresponding vehicle controls.
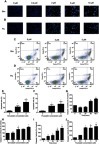
Figure 3 Simvastatin or atrovastatin inhibition of cell viability (A and C) and promotion of cell apoptosis (B and D) in DU145 or PC3 cells, respectively. (A) shows a time- and dose-dependent inhibition of cell viability by simvastatin in DU145 cells using MTS assay. The data are the mean ± SEM of three independent experiments (n=3) and presented as a percentage of corresponding vehicle controls. (B) shows representative images of Hoechst 33258 staining of cells treated with or without various doses of simvastatin. (C) shows a time- and dose-dependent inhibition of cell viability by atrovastatin in PC3 cells using MTS assay. (D) shows representative images of Hoechst 33258 staining of cells treated with or without various doses of atrovastatin. The images were taken under fluorescence microscope using a blue filter at ×200 magnification.
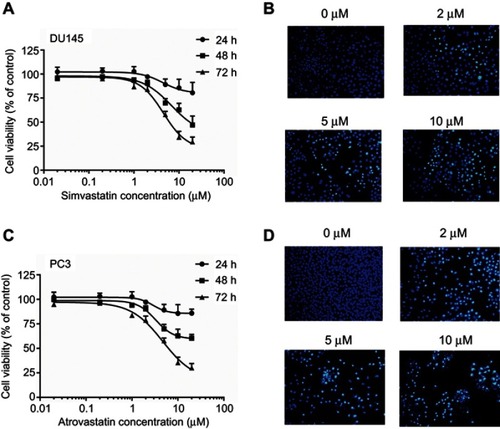
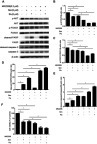
Figure 4 Western blot analysis of simvastatin (Sim) and fluvastatin (Flu) promotion of cell apoptosis in PC3 cells. (A and B) and (C and D) show representative Western blot images and quantitative analyses of dose-dependent effects of simvastatin and fluvastatin on the cleavage of PARP, caspase 8 and caspase 3 in PC3 cells, respectively. The quantitative data are the mean ± SEM of three independent experiments and expressed as folds of corresponding control. (E and F) show respectively a representative Western blot image and quantitative analysis of simvastatin effects on BCL-2 and BAX expression in PC3 cells. (G and H) show respectively a representative Western blot image and quantitative analysis of fluvastatin effects on CHOP and FAS-L expression in PC3 cells. *p<0.05 compared to the corresponding control.
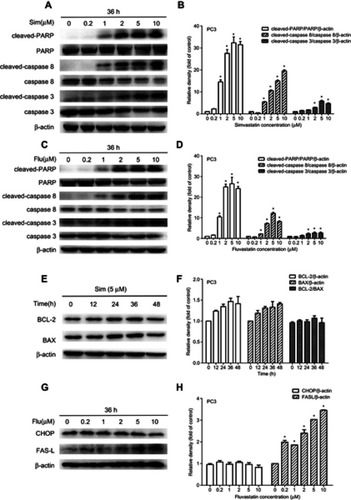
Figure 5 Time and dose-dependent inhibition of AKT and FOXO1 phosphorylation by simvastatin (Sim) and fluvastatin (Flu) in PC3 cells. PC3 cells were treated with either 5 μM simvastatin (A) or fluvastatin (C) for 0–48 h or various doses of simvastatin (E) or fluvastatin (G) for 36 h. Total cellular proteins were extracted and analyzed for phosphorylated-AKT (p-AKT, Ser-473), AKT, p-FOXO1 (Ser-256) and FOXO1 by Western blot as described in the Methods. The quantitative data are the mean ± SEM of three independent experiments and expressed as folds of corresponding control (B, D, F, H). *p<0.05 compared to the corresponding control.
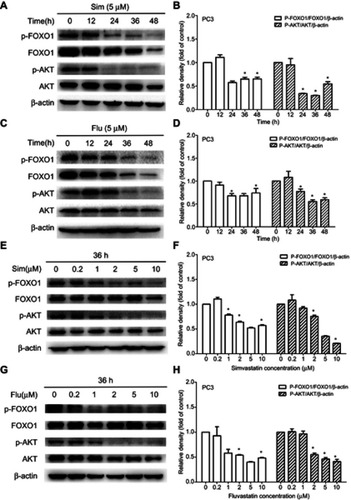
Figure 6 A dose-dependent stimulation of FOXO1 nuclear translocation by simvastatin and fluvastatin in PC3 cells. PC3 cells were treated with various doses of either simvastatin (Sim) or fluvastatin (Flu) for 36 h, and the nuclear (N) and cytosolic (C) proteins were isolated and analyzed by Western blotting (A and C). Lamin-B and β-actin were used as a loading control for nuclear and cytosolic proteins, respectively. The quantitative data in (B and D) are the mean ± SEM of three independent experiments and expressed as folds of vehicle control. *p<0.05 compared to the corresponding control.
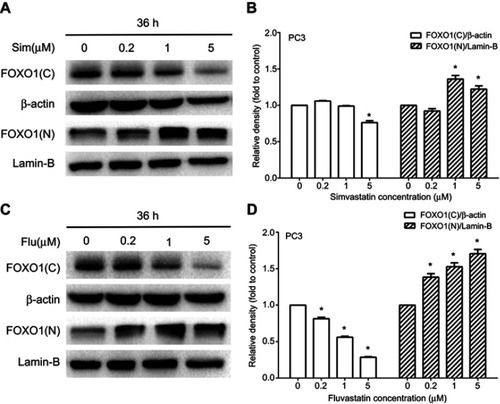
Figure 7 Potentiation of simvastatin (Sim) and fluvastatin (Flu) inhibition of AKT and FOXO1 phosphorylation and cell viability while promotion of cell apoptosis by the AKT kinase inhibitor in PC3 cells. PC3 cells were treated with or without 5 μM simvastatin or fluvastatin for 36 h following a pretreatment with or without 0.2 μM MK2206 for 60 min. Total cellular proteins were prepared and immunoblotted for p-AKT(Ser-473), AKT, p-FOXO1 (Ser-256), FOXO1, cleaved-PARP, PARP, cleaved-caspase 3 and caspase 3 (A). β-actin was used as a loading control. The quantitative data in (B-E) are the mean ± SEM of three independent experiments and expressed as folds of vehicle control. (F) shows the alterations of cell viability expressed as percentage of vehicle control in PC3 cells treated with or without MK2206 (0.2 μM), Sim (5 μM) and Flu (5 μM) alone or in combination for 48 h in PC3 cells. *p<0.05 compared to the corresponding control.