Figures & data
Figure 1 Sanguinarine (SNG) has antiproliferative and apoptotic effects in HeLa cells. (A) Cell viability was analyzed using MTT cell proliferation assay kits. HeLa cells were treated with different concentrations of SNG (0, 0.5, 1, 2.5, 5, 10, and 20 μM) for up to 24 hrs or 48 hrs. IC50 values were calculated. (B) Effect of varying SNG concentrations on cervical cancer cell colony formation. Cells were incubated with SNG (0.5, 1, and 2 μM) for 10 hrs and allowed to grow for 9–10 days. Colonies were stained by crystal violet dye. Then, the number of colonies was counted. (C) The colony formation ability of each group was shown in bar chart. (D) HeLa cells were exposed to SNG (2, 4, and 6 μM) for 24 hrs. Percentage of cell apoptosis was determined by Annexin-V/PI staining and flow cytometry. Similar results were obtained in three independent experiments. (E) The percentage of apoptotic cells in the treatment groups was quantified. (F) Expression of apoptosis-related proteins Bcl-2 and Bax was determined by Western blot after treatment with SNG (2, 4, or 6 μM) for 24 hrs in cervical cancer cells. GAPDH was used as internal control. (G) Quantification of data presented in panel F. All data here are expressed as means ± SD of triplicates. All images shown here are representative of three independent experiments with similar results. Data are shown as mean ± SEM (n=3) (*P<0.05, **P<0.01, ***P<0.001; #P<0.05, ##P<0.01, ###P<0.001; all versus DMSO group).
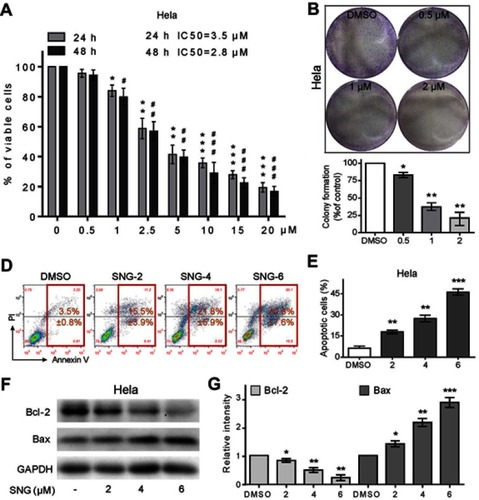
Figure 2 Sanguinarine (SNG) induces ROS accumulation and ROS-dependent apoptosis in HeLa cells. (A) Intracellular ROS generation dose-dependently induced by SNG (2, 4, and 6 μM) was measured in HeLa cells by staining with DCFH-DA (10 μM) and flow cytometry analysis. HeLa cells were treated with SNG for 3 hrs. (B) Effect of NAC (5 mM) pretreatment of 2 hrs on ROS levels. Then, Intracellular ROS generation was measured by flow cytometer. (C) HeLa cells were preincubated with or without NAC (5 mM) for 2 hrs before exposure to SNG at the indicated concentrations (2, 4, and 6 μM) for 24 hrs. Percentage of cell apoptosis was determined by Annexin-V/PI staining and flow cytometry. Similar results were obtained in three independent experiments. (D) The percentage of apoptotic cells in the treatment groups was quantified. (E) Expression of apoptosis-related proteins Bcl-2 and Bax was determined by Western blot after treatment with SNG (6 μM) or SNG (6 μM) + NAC (5 mM) pretreated or NAC (5 mM) for 18 hrs in HeLa cells. GAPDH was used as internal control. (F) Quantification of data presented in panel E. All images shown here are representative of three independent experiments with similar results. Data are shown as mean ± SEM (n=3) (*P<0.05, **P<0.01, ***P<0.001).
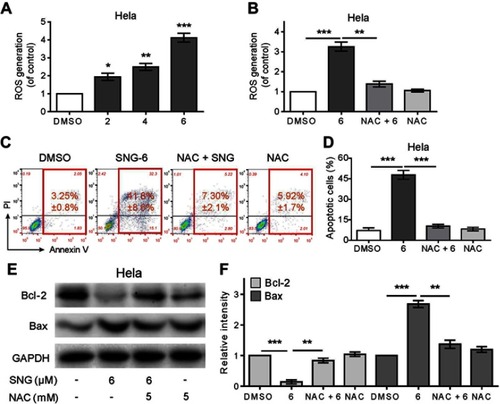
Figure 3 Sanguinarine (SNG) inhibits STAT3 phosphorylation in HeLa cells. (A) The levels of p-STAT3 and STAT3 were detected by Western blot in HeLa cells. STAT3 was used as internal control. (B) Quantification of data presented in panel A. (C) HeLa cells were preincubated with or without NAC (5 mM) before exposure to SNG (6 μM) for 12 hrs, and the expression of p-STAT3 and STAT3 was detected by Western blot. STAT3 was used as internal control. (D) Quantification of data presented in panel C. The results shown are representative of at least three independent experiments. Data are shown as mean ± SEM (n=3) (*P<0.05, **P<0.01, ***P<0.001).
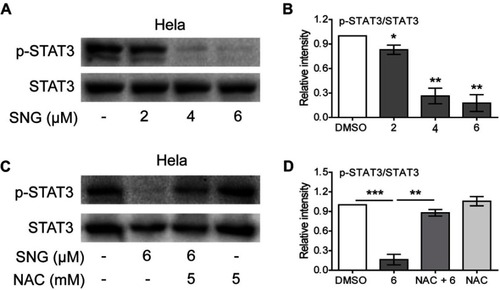
Figure 4 Sanguinarine (SNG) inhibits HeLa xenograft tumor growth in vivo. (A) SNG (5 mg/kg) treatment significantly inhibited tumor volume. (B) SNG (5 mg/kg) treatment significantly reduced tumor weight. (C) SNG treatment did not affect the bodyweight of mice. (D) HE staining of the major organs (liver, kidney), magnification 20x. (E) The levels of MDA in the tumor tissues. (F) Western blot analysis on the expression of p-STAT3 and STAT3 from respective tumor tissue lysates. STAT3 was used as protein loading control. (G) Quantification of data presented in panel F. The results shown are representative of at least three independent experiments. Data are shown as mean ± SEM (n=3) (*P<0.05, **P<0.01, ***P<0.001).
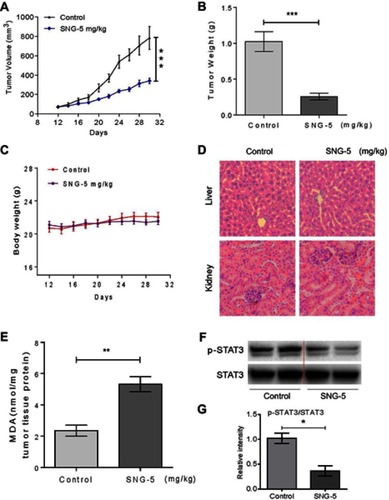
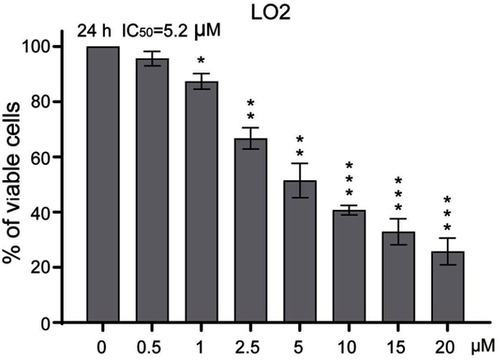
Figure S1 Sanguinarine (SNG) shows little toxic effect in normal LO2 cells. Cell viability was analyzed using MTT cell proliferation assay kits. LO2 cells were treated with different concentrations of SNG (0, 0.5, 1, 2.5, 5, 10, and 20 μM) for up to 24 hrs. IC50 values were calculated. All images shown here are representative of three independent experiments with similar results. Data are shown as mean ± SEM (n=3) (*P<0.05, **P<0.01, ***P<0.001).