Figures & data
Table 1 Demographics, patient characteristics in overall study population and by cachexia group
Table 2 COX regression analysis of the relationship between OS and cachexia or patient characteristics
Figure 1 Kaplan–Meier curve for overall survival (OS) in patients with and without cachexia.
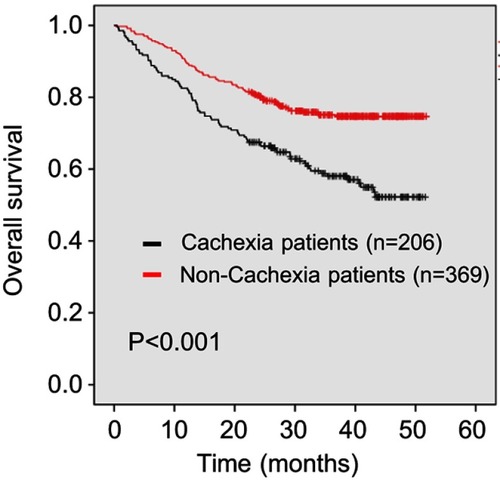
Figure 2 Frequency distribution of patients of different ages stratum with and without cachexia.
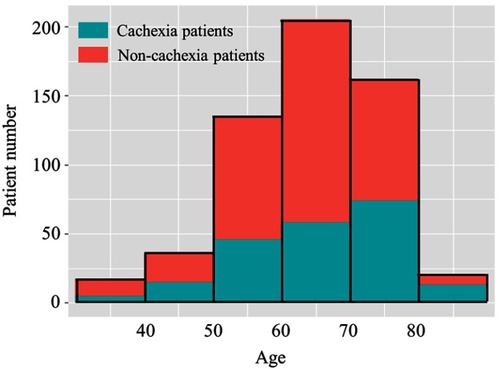
Table 3 COX regression analysis of the relationship between OS and cachexia in patients with different ages
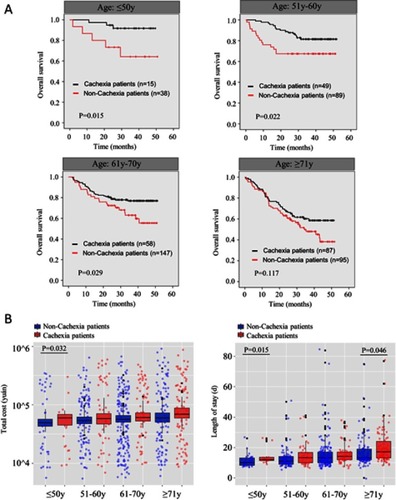
Figure 3 (A) Kaplan–Meier curve for overall survival (OS) in different ages stratum with and without cachexia. (B) Total cost and length of hospital stay in different ages stratum with and without cachexia.