Figures & data
Figure 1 Matrine in combination with docetaxel reduces the proliferation of prostate cancer cells. (A, B) Plots of the cell growth of prostate DU145 (A) and PC-3 cells (B) incubated with different concentrations of matrine and docetaxel for increasing time periods. Values of OD490 represent the number of viable cells. Data here or throughout are the average ± standard deviation of at least three repeats. Statistical significance was determined by t-test. *P≤0.05. (C, D) Plots of the growth inhibition rates of prostate DU145 (C) and PC-3 cells (D) incubated with different concentrations of matrine and docetaxel for increasing time periods. (E, F) Plots of the proliferation rates of prostate DU145 (E) and PC-3 cells (F) incubated with different concentrations of matrine and docetaxel for increasing time periods. *P≤0.05.
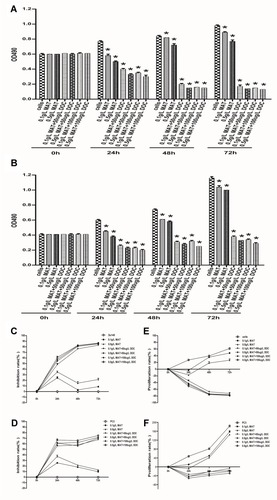
Figure 2 Matrine in combination with docetaxel impairs the invasion and migration of prostate cancer cells. (A–D) Representative images (A, B) and plots of the number (C, D) of invaded DU145 (A, C) and PC-3 cells (B, D) per 10,000 seeded cells. (E–H) Representative images (E, F) and plots of the number (G, H) of migrated DU145 (E, G) and PC-3 cells (F, H) per 10,000 seeded cells in the presence of different concentrations of matrine and docetaxel for 48 hrs. *P≤0.05.
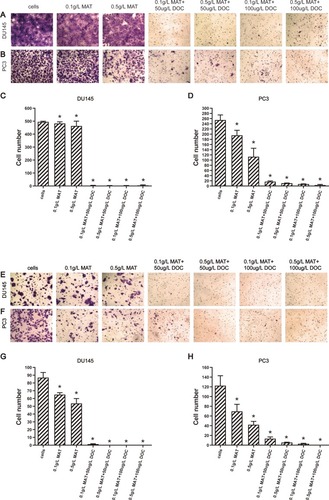
Figure 3 Matrine in combination with docetaxel promote the levels of IL-1β (A), IL-18 (B), and LDH (C) in prostate cancer cells. *P≤0.05.
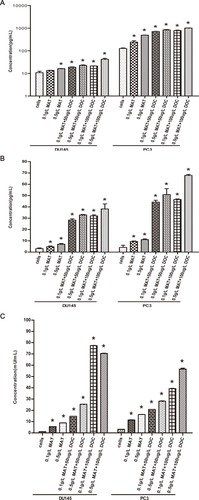
Figure 4 Matrine in combination with docetaxel promotes the apoptosis of prostate cancer cells. (A, B) Representative dot plots of apoptotic cells detected in the DU145 (A) and PC-3 cells (B) treated with different concentrations of matrine and docetaxel by flow cytometry. (C–H) Plots of the percentages of early (C, D), late (E, F), and total apoptotic cells (G, H) in the DU145 (C, E, G) and PC-3 cells (D, F, H) treated with different concentrations of matrine and docetaxel. *P≤0.05.
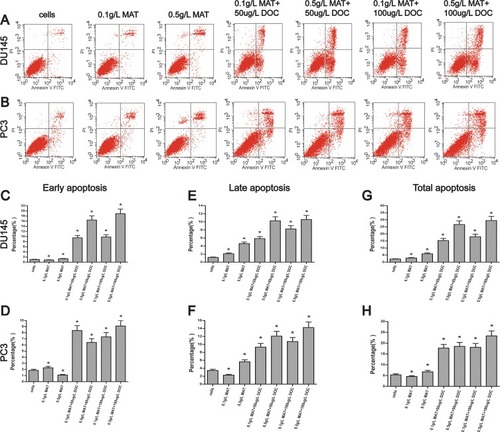
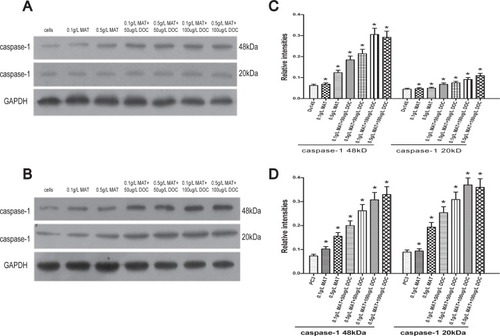
Figure 5 Matrine in combination with docetaxel promote the expression levels of caspase-1 48 kDa and caspase-1 20 kDa in prostate cancer cells. (A, B) Representative immunoblot results showing the intensities of caspase-1 48 kDa and caspase-1 20 kDa in DU145 (A) and PC-3 cells (B) treated with matrine and docetaxel at the concentrations as indicated. (C, D) Plots of the relative intensities of proteins shown in panels A and B as representatives against different concentrations of matrine and docetaxel in DU145 (C) and PC-3 cells (D). Levels of proteins are the ratios to GAPDH levels. *P≤0.05.