Figures & data
Figure 1 The process of case inclusion and exclusion in this study.
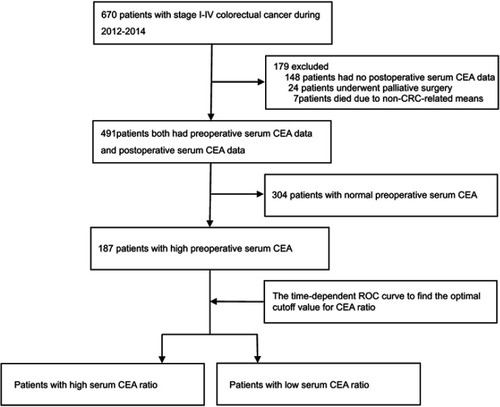
Table 1 Comparison of baseline clinicopathological characteristics based on CEA ratio
Figure 2 Time-dependent receiver operating characteristic (ROC) curve of CEA ratio in CRC patients with high preoperative serum CEA.
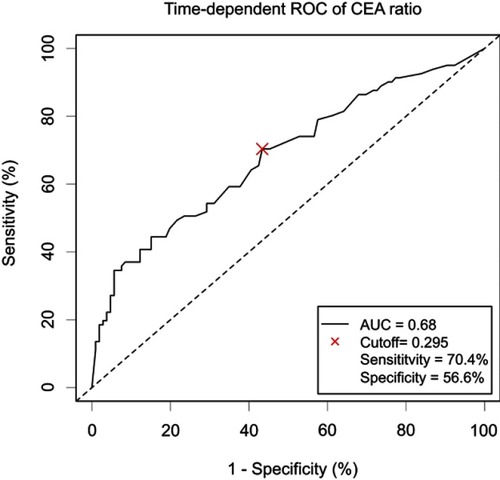
Table 2 Univariate and multivariate survival analyses of clinicopathological covariates in CRC patients
Figure 3 Subgroup multivariate analysis of CEA ratio on each baseline feature in DFS (A), CSS (B).
Abbreviations: DFS, disease-free survival; CSS, cancer-special survival.
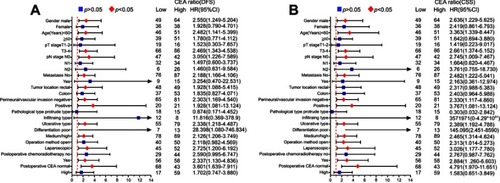
Figure 4 Comparison of the CEA ratio survival curves based on postoperative CEA level.
Notes: (A) Kaplan–Meier curves of DFS in low postoperative CEA level patients. (B) Kaplan–Meier curves of DFS in high postoperative CEA level patients. (C) Kaplan–Meier curves of CSS in low postoperative CEA level patients. (D) Kaplan–Meier curves of CSS in high postoperative CEA level patients.
Abbreviations: DFS, disease-free survival; CSS, cancer-special survival.
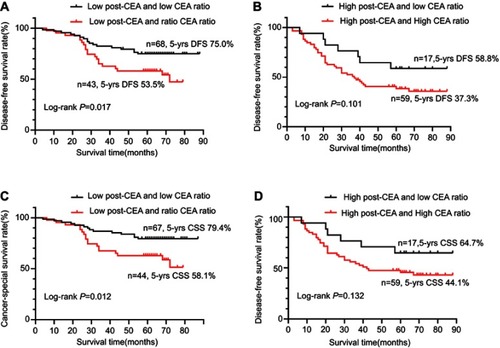
Figure 5 Comparisons of Kaplan–Meier curves of DFS and CSS between two groups (High CEA ratio; Low CEA ratio) in each TNM stage.
Notes: (A) Kaplan–Meier curves of DFS in TNM II stage patients. (B) Kaplan–Meier curves of DFS in TNM III stage patients. (C) Kaplan–Meier curves of DFS in all TNM stages patients. (D) Kaplan–Meier curves of CSS in TNM II stage patients. (E) Kaplan–Meier curves of CSS in TNM III stage patients. (F) Kaplan–Meier curves of CSS in all TNM stage patients.
Abbreviations: DFS, disease-free survival; CSS, cancer-special survival.
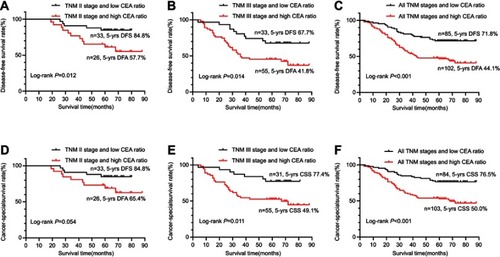
Table 3 Comparison of cutoff values of CEA ratio
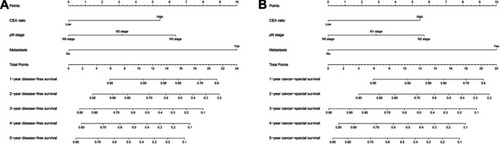
Figure 6 Development of the nomogram.
Notes: The nomogram can provide individual patients with a probability of 1–5 years disease-free survival (A) and cancer-special survival (B) based on the sum of the scores for each variable predicted at the bottom scale.
Abbreviations: DFS, disease-free survival; CSS, cancer-special survival.