Figures & data
Table 1 Primer sequences of Smo and GAPDH
Table 2 Primary data of the patients included in the study
Figure 1 Smo expression level in new case and control groups. (A) Significant upregulation of Smo expression relative to GAPDH as a housekeeping gene in B-ALL subjects compared with the control group using RT-PCR assay (***P=0.0002). (B) Diagnostic potential of Smo. ROC curve analyses showed that the mRNA Smo expression levels could distinguish B-ALL children from non-leukemic controls (AUC=0.84, P=0.0007).
Abbreviations: B-ALL, B-cell acute lymphoblastic leukemia; ROC, receiver operating characteristic.
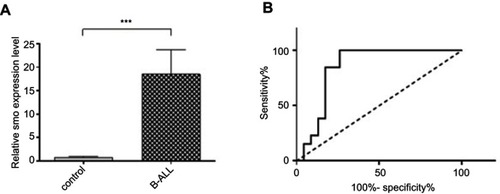
Figure 2 Comparison between the MDR (MRD+ and relapsed) and MRD- groups with respect to the Smo expression levels. (A) Significant increased Smo expression in MDR patients, known as resistant group, compared with MRD-, considered as sensitive group (*P=0.0128). (B) Prognostic potential of Smo using ROC curve analyses. Smo transcript level could significantly discriminate MDR patients from MRD- ones (AUC of 0.82, P=0.0117).
Abbreviations: MDR, multidrug resistance; ROC, receiver operating characteristic.
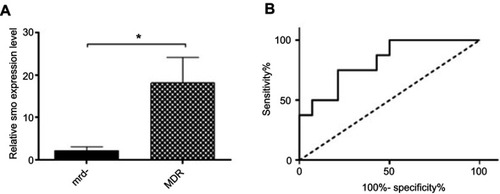
Table 3 The expression profile of Smo at the mRNA and protein levels in 18 patients with B-ALL
Figure 3 Western blot analysis of Smo protein expression in 18 available samples for protein analysis. Numbers 1–9, 17, and 18=Samples of patients with multidrug resistance (MDR), Numbers 10–16=Samples of sensitive patients to chemotherapy (MRD-).
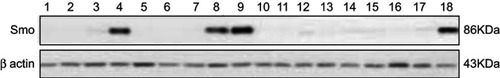
Table 4 Non-parametric binomial test to examine the correlation between miR-326 and Smo expression levels
Figure 4 Possible correlation between the mRNA expression levels of Smo and miR-326 was determined using a Spearman’s correlation test. (A) Inverse correlation between the expression levels of Smo and miR-326 in the multidrug resistant, MDR, ALL patients (r=−0.68, P=0.045). (B) Inverse correlation between the mRNA expression levels of Smo and miR-326 in patients with B-ALL (r=−0.626, P=0.002).
Abbreviations: MDR, multidrug resistance; B-ALL, B-cell acute lymphocytic leukemia.
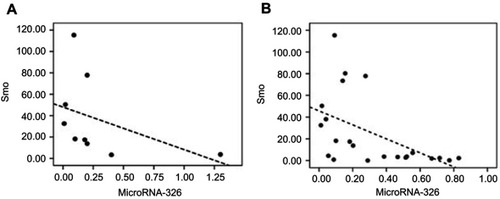
Figure 5 Investigating any possible association between the mRNA expression levels of Smo and ABCA3 in drug-resistant patients. Spearman’s correlation test showed a direct correlation between the mRNA expression levels of Smo and ABCA3 genes (r=0.607, P=0.016).
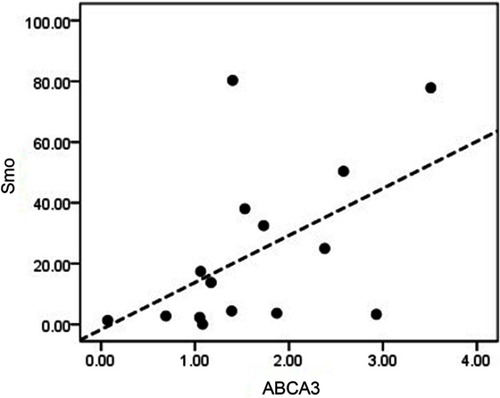
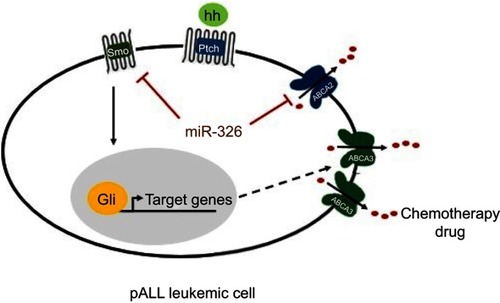
Figure 6 Possible mechanism of drug resistance related to miR-326 in pediatric acute lymphoblastic leukemia (pALL) leukemic cells. Smo gene targeted by miR-326 may regulate the stemness-related target genes of Hh pathway. It may contribute to leukemic cells survival and, subsequently, overexpression of the drug resistance gene, ABCA3, followed by efflux of the prescribed chemotherapy drugs. In addition, it is likely that miR-326 completes its role in drug resistance through the regulation of ABCA2 transporter. Black arrow, stimulation; red blunt-ended arrow, direct inhibition; dashed arrow, unconfirmed indirect effect; hh, protein ligand; pALL, pediatric acute lymphoblastic leukemia.