Figures & data
Figure 1 MIR31HG is an oncogene for osteosarcoma (OS) patients. (A) The expression of MIR31HG in OS and paracancerous tissues (n=40) was analyzed by Q-PCR. (B–E) Correlations between tumor localization, tumor size, clinical stage, distant metastasis and MIR31HG expression were determined. *P<0.05, **P<0.01, ***P<0.001, data represent the means±SD.
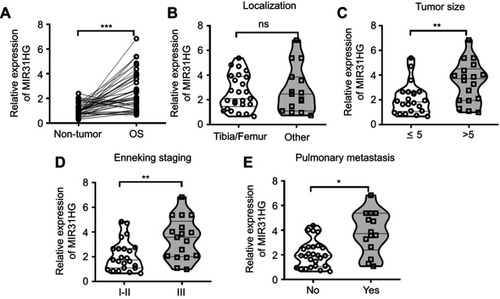
Figure 2 MIR31HG inhibits miR-361 level in OS cell lines. (A) The expression of MIR31HG was estimated in OS cell lines 143B, MG63, U2OS and Saos-2 cells and human osteoblastic cell line hFOB1.19 cells. (B) Knockdown of MIR31HG by two independent siRNA showed no effects on the miR-31 in U2OS and Saos-2 cells. (C) Bioinformatic analysis (http://carolina.imis.athena-innovation.gr/diana_tools/web/index.php) showed that MIR31HG harbor different binding sites of miR-361, blue letters showed the binding sites. (D) The Saos-2 cell line was transfected with luciferase reporters that contained MIR31HG with wild-type (WT) or mutated-type (MUT) miR-361 binding sites or miR-361 mimics, the luciferase activity was determined. (E) Knockdown of MIR31HG by two independent siRNA reduced the miR-31 level in U2OS and Saos-2 cells. (F) The expression of miR-361 was estimated in OS cell lines 143B, MG63, U2OS and Saos-2 cells and human osteoblastic cell line hFOB1.19 cells. *P<0.05, **P<0.01, data represent the means±SD. All experiments were performed at least three times.
Abbreviations: OC, osteosarcoma; NC, normal control; NS, non-significant.
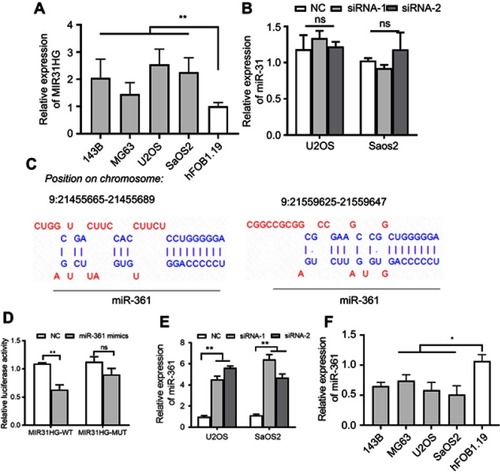
Figure 3 MiR-361 is tumor suppressor for OS patients. (A) The expression of miR-361 in OS and paracancerous tissues (n=40) was analyzed by Q-PCR. (B–F) Correlations between MIR31HG expression, tumor localization, tumor size, clinical stage, distant metastasis and miR-361 expression were determined. *P<0.05, ***P<0.001, data represent the means±SD.
Abbreiviations: OC, osteosarcoma; NS, non-significant.
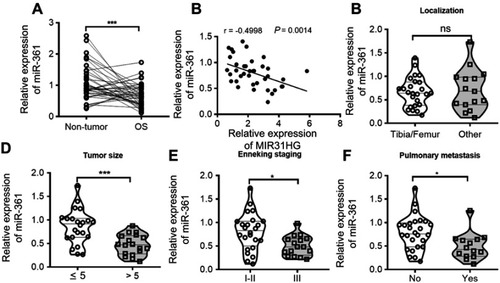
Figure 4 MIR31HG inhibits the tumor-suppressive role of miR-361 in vitro in osteosarcoma (OS). (A) The U2OS and Saos-2 cell lines were overexpressed of miR-361 mimics and/or pcDNA3.1-MIR31HG. (B, C) The cell vitality, (D, E) cell cycle, (F) apoptosis of two cell lines were determined by CCK-8 assay, Flow cytometry, Hoechst assay, respectively. (G) Cell migration was determined by Transwell assay, 2×10⁵ U2OS and Saos-2 cells were seeded into the upper chamber containing a filtration membrane with a pore size of 8 μm. After incubation for 24 hrs, the results of cell migration were observed, photographed and cells were enumerated in 5 random fields. *P<0.05, **P<0.01, ***P<0.001, data represent the means±SD. All experiments were performed at least three times.
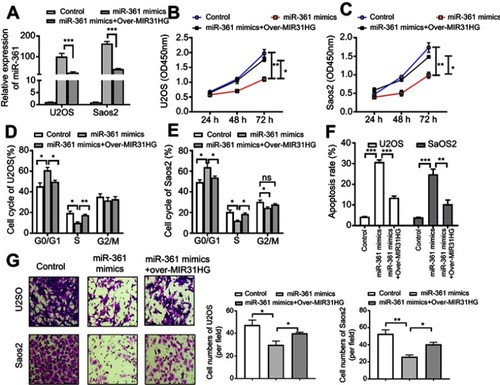
Figure 5 The expressions of target genes of miR-361 are restored by MIR31HG. (A, B) After transfection as indicated, the target genes’ expression of miR-361 including oncogene VEGF, FOXM1 and Twist was determined by Western blot in U2OS and Saos-2 cell lines, and the down-stream signals BCL2, CCND1, E-cadherin and N-cadherin were also analyzed by Western blot. (C–E) The expression of VEGF, FOXM1 and Txis in osteosarcoma (OS) tissues with MIR31HG upregulation was estimated by Q-PCR. The high and low expression of MIR31HG was determined by median. *P<0.05, **P<0.01, ***P<0.001, data represent the means±SD. All experiments were performed at least three times.
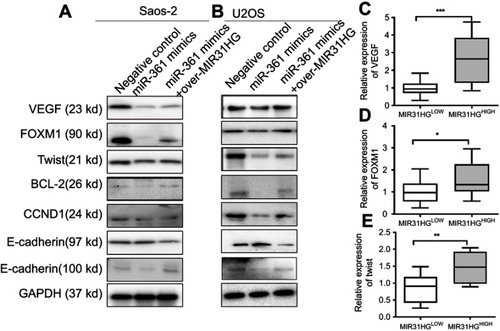
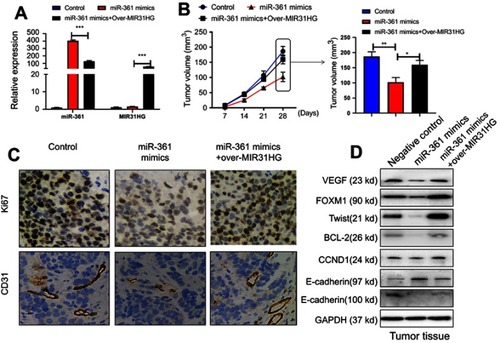
Figure 6 MIR31HG promotes osteosarcoma (OS) growth via miR-361 inhibition in vivo. The mice were sacrificed to terminate the experiment at day 28. (A) The Saos-2 cell line was infected with lentivirus-miR-361 mimics and/or pcDNA3.1-MIR31HG for long time expression. The expressions of miR-361 and MIR31HG in tumor tissues were confirmed by Q-PCR. (B) The tumor volume was calculated every three days apart. (C) The microvessel marker CD31 and proliferation index Ki-67.was determined by immunohistochemistry. (D) The expressions of VEGF, FOXM1, Txis, BCL2, CCND1, E-cadherin and N-cadherin in tumor tissues were determined by Western blot. *P<0.05, **P<0.01, ***P<0.001, data represent the means ± SD.