Figures & data
Figure 1 Expression of HDGF is higher in BCa tissue and appears to be closely related to muscle invasion and CCS (All the data from ONCOMINE database). (A) Meta-analysis of the HDGF mRNA expression between the BCa and normal urothelial tissue (p<0.001). (B and C) HDGF expression is elevated in MIBC compared to NMIBC and normal tissues according to DB3 and Lee Bladder databases (p<0.01). (D and E) The Kaplan-Meier analysis indicates overexpression of HDGF predicts poor CCS but not OS using Lee Bladder database.
Abbreviations: HDGF, Hepatoma-derived growth factor; BCa, Bladder cancer; CCS, Cancer-specific survival; OS, Overall survival.
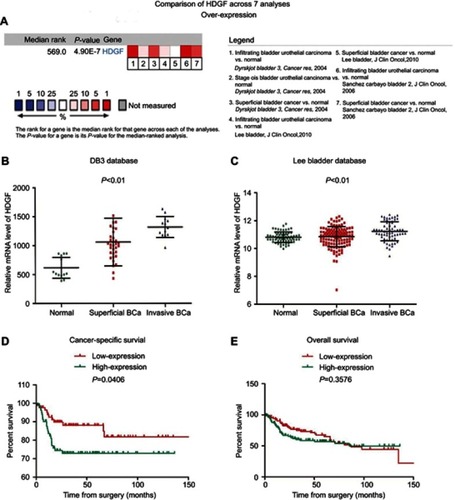
Table 1 Clinicopathological parameters and Hepatoma-derived growth factor (HDGF) expression level in 165 BCa patients based on Lee Bladder database
Figure 2 Lentivirus-mediated interference downregulates the expression of Hepatoma-derived growth factor (HDGF) in BCa cells. (A) The bladder cancer cells are examined by fluorescence microscopy after lentivirus infection for 72 h. (B–C) Real-time qPCR indicates mRNA levels are lower in T24 and 253J cells infected with Lv-shHDGF than Lv-shCon. (D–E) The protein levels of HDGF are downregulated in T24 and 253J cells infected with Lv-shHDGF. Every result is verified at least three times. (*p<0.05; ***p<0.001).
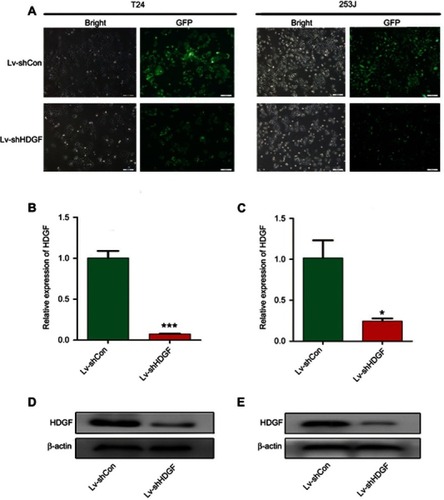
Figure 3 Knockdown of HDGF dramatically inhibits the proliferation, migration and invasion of BCa cells. (A) The growth curves of BCa cells infected with Lv-shCon or Lv-shHDGF were determined by CCK-8 assay. (B–C) Representative images of T24 and 253J cells colony information after infection with Lv-shCon or Lv-shHDGF. (D–E) Transwell migration assay in T24 and 253J cells with stable HDGF knockdown and control plasmid expression; (F–G) Transwell invasion assay in BCa cells with stable HDGF down-regulated and control. (H) Representative Western blot results of proteins related to EMT in T24 and 253J cells with stable HDGF knockdown and control plasmid. (I) The gray intensity quantification of EMT of T24 and 253J cells. (*p<0.05; **p<0.01; ***p<0.001).
Abbreviation: EMT, epithelial-mesenchymal transition.
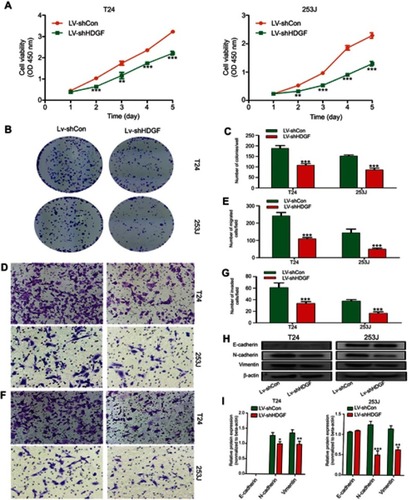
Figure 4 HDGF deletion represses cell cycle and induces apoptosis of BCa cells. (A–B) Representative cell cycle data was measured by flow cytometry in BCa cells infected with Lv-shHDGF or Lv-shCon. (C) Western blot results of proteins related to cell cycle in T24 and 253J cells with stable Hepatoma-derived growth factor (HDGF) knockdown or control expression. (D–E) Apoptosis of BCa cells infected with Lv-shHDGF or Lv-shCon were analyzed by flow cytometry. (F) Proteins involved in apoptosis was analyzed by Western blot. (*p<0.05, **p<0.01; ***p<0.001).
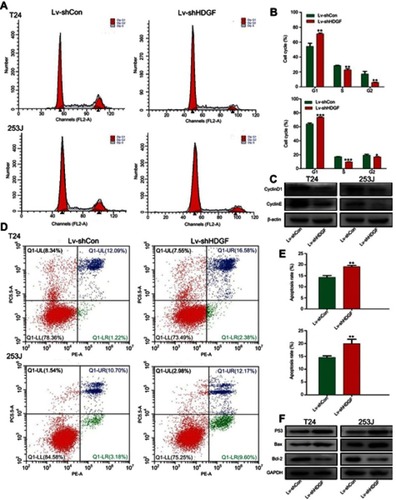
Figure 5 HDGF deletion suppresses T24 cell tumorigenicity in vivo. (A) Representative picture of animals and xenograft tumors. (B) Weights of xenograft tumors derived from T24 cells with HDGF deletion and control. (C) Tumors sizes were measured after tumors were dissected. (D) IHC examination of HDGF and Ki-67 in tumor sections (magnifications×400). (E) Histogram shows IHC scores in control and Hepatoma-derived growth factor (HDGF) deletion group. (*p<0.05; ***p<0.001).
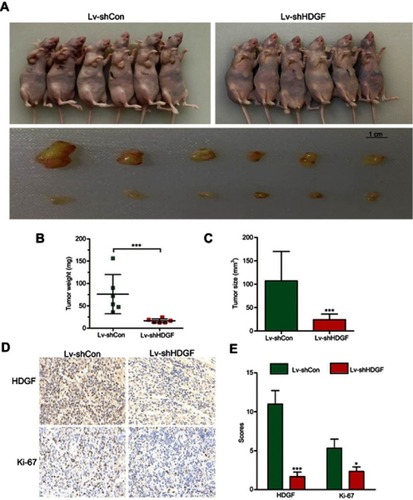
Figure 6 HDGF downregulated affects PI3K-AKT pathway. (A) Heat map representing unsupervised hierarchical clustering of mRNA expression levels in 253J cells infected with Lv-shHDGF or Lv-shCon. Red and Blue indicate high and low expression respectively. (B) Go analysis including the cellular component, biological process and molecular function was performed on DEGs. (C) Hepatoma-derived growth factor (HDGF) positively regulates PI3K-AKT signaling pathway based on KEGG analysis. (D) PPI analysis of HDGF and the PI3K-AKT pathway related genes.
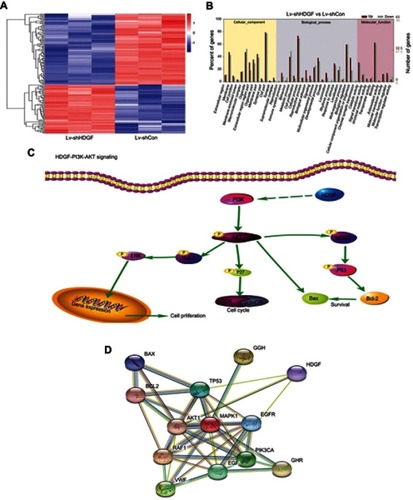
Figure 7 The expression level of key genes related to the PI3K-AKT pathway. (A) RAN-seq analysis indicates mRNA level of HDGF, PI3K and AKT in 253J cells with stable Hepatoma-derived growth factor (HDGF)knockdown and control expression. (B) Representative Western blot results of proteins related to PI3K-AKT pathway in 253J cells infected with Lv-shHDGF or Lv-shCon. (*p<0.05, **p<0.01; ***p<0.001).
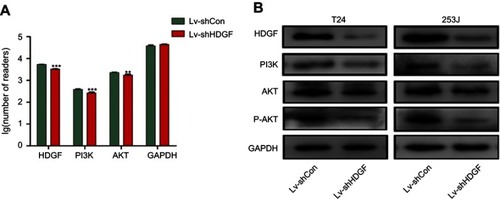
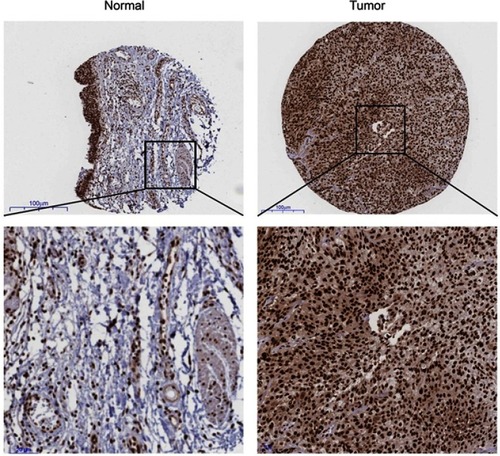
Figure S1 Representative image of IHC staining of HDGF in normal bladder tissues and BCa tissues (upper: ×40; lower: ×400) (Date comes from public database-The Human Protein Atlas portal (www.proteinatlas.org)).