Figures & data
Figure 1 Knockdown and knockout of TAZ in the lentiviral-transduced SMMC-7721 and SK-HEP1 cells.
Notes: (A) Western blot analysis of TAZ and YAP proteins in four HCC cell lines with different spontaneous metastatic potential. GAPDH served as loading control. Representative blots are shown (n=3). (B) TAZ mRNA levels were evaluated from SMMC-7721 and SK-HEP1 cells stably expressing shRNA specific for TAZ (KD TAZ) and the corresponding vector control (Ctrl) using RT-qPCR, and normalized against GAPDH. Data are the mean±SD (n=4). P-values were obtained from Student’s t test. *P<0.05. (C) Knockdown of TAZ (KD TAZ) was determined by Western blotting in SMMC-7721 and SK-HEP1 cells, and GAPDH served as a loading control. Representative blots are shown (n=3). (D) Knockout of TAZ (KO TAZ) was confirmed by Western blot analysis in SMMC-7721 and SK-HEP1 cells, and GAPDH served as a loading control. Representative blots are shown (n=3). (E) Quantitative analysis of CTGF and CYR61 mRNA in stable TAZ knockdown and knockout SMMC-7721 and SK-HEP1 cells by RT-qPCR, and normalized against GAPDH. Data were shown as the mean ±SD (n=4). P-values were obtained from Student’s t test. *P<0.05.
Abbreviations: TAZ, transcriptional co-activator with PDZ-binding motif; YAP, yes-associated protein; GAPDH, glyceraldehyde-3-phosphate dehydrogenase; KD TAZ, knockdown of transcriptional co-activator with PDZ-binding motif; RT-qPCR, reverse transcription-quantitative polymerase chain reaction; KO TAZ, knockout of transcriptional co-activator with PDZ-binding motif; CTGF, connective tissue growth factor; CYR61, cysteine-rich angiogenic inducer 61; HCC, hepatocellular carcinoma.
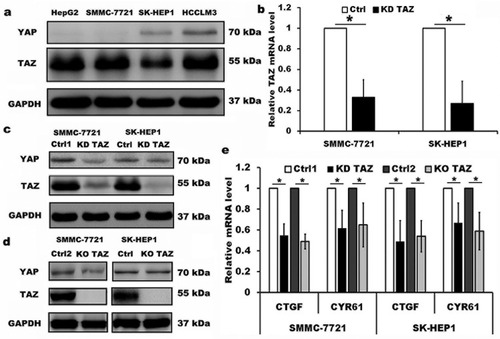
Figure 2 TAZ knockdown and knockout attenuated the migration and invasion of SMMC-7721 and SK-HEP1 cells.
Notes: (A and B) Migration and invasion of stable TAZ knockdown and knockout SMMC-7721 and SK-HEP1 cells and their corresponding control cells were determined by Transwell assays. Representative images of three independent experiments are shown. Scale bar =50 μm. (C and D) Quantification of relative numbers of migrated and invaded cells in five randomly fields for each replicate was shown. All experiments were performed independently three times and data were shown as mean±SD. P-values were obtained from Student’s t test. *P<0.05.
Abbreviations: TAZ, transcriptional co-activator with PDZ-binding motif; KD TAZ, knockdown of transcriptional co-activator with PDZ-binding motif; KO TAZ, knockout of transcriptional co-activator with PDZ-binding motif.
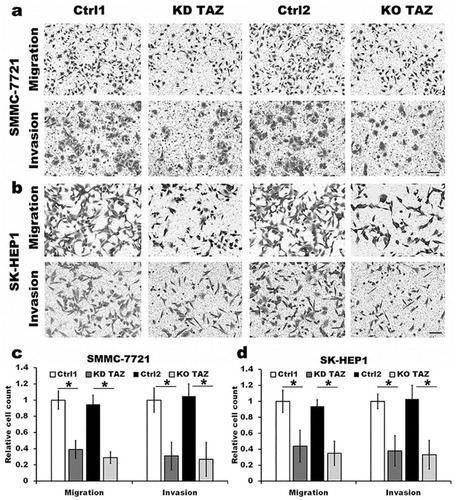
Figure 3 TAZ knockdown and knockout reduced epithelial-mesenchymal transition (EMT) of SMMC-7721 and SK-HEP1 cells.
Notes: (A and B) Quantitative analysis of mRNA levels of EMT markers in stable TAZ knockdown and knockout SMMC-7721 (A) and SK-HEP1 cells (B) by RT-qPCR, and normalized against GAPDH. Data were shown as the mean±SD (n=4). P-values were obtained from Student’s t test. *P<0.05. (C and D) Protein levels of EMT markers were determined by Western blot in SMMC-7721 (C) and SK-HEP1 cells (D), and GAPDH was used as a loading control. Representative blots are shown (n=3).
Abbreviations: TAZ, transcriptional co-activator with PDZ-binding motif; E-CAD, E-cadherin; β-CAT, β-catenin; VIM, Vimentin; N-CAD, N-cadherin; RT-qPCR, reverse transcription-quantitative polymerase chain reaction; GAPDH, glyceraldehyde-3-phosphate dehydrogenase; KD TAZ, knockdown of transcriptional co-activator with PDZ-binding motif; KO TAZ, knockout of transcriptional co-activator with PDZ-binding motif.
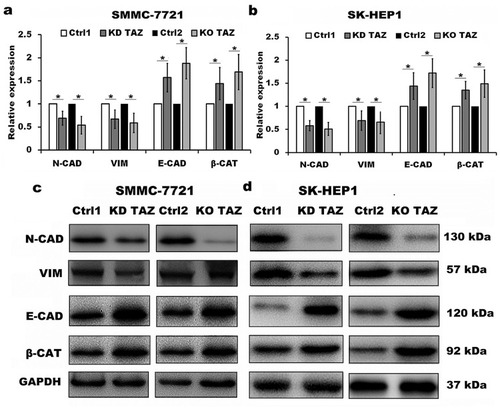
Figure 4 TAZ knockdown and knockout stimulated autophagy activity in SMMC-7721 and SK-HEP1 cells.
Notes: (A and B) Quantitative analysis of mRNA levels of LC3B, ULK1 and p62 in stable TAZ knockdown and knockout SMMC-7721 (A) and SK-HEP1 cells (B) by RT-qPCR, and normalized against GAPDH. Data were shown as the mean±SD (n=4). P-values were obtained from Student’s t test. *P<0.05. (C and D) Protein levels of LC3B, ULK1 and p62 were determined by Western blot in SMMC-7721 (C) and SK-HEP1 cells (D), and GAPDH was used as a loading control. Representative blots are shown (n=3). (E and F) The autophagic flux was observed in stable TAZ knockdown and knockout SMMC-7721 (E) and SK-HEP1 cells (F) after retrovirally transfected with GFP-LC3-RFP-LC3ΔG reporter construct, and representative images are shown (n=3). Scale bar =10 μm.
Abbreviations: TAZ, transcriptional co-activator with PDZ-binding motif; LC3B, microtubule-associated protein 1 light chain 3 beta; ULK1, unc-51 like autophagy activating kinase 1; RT-qPCR, reverse transcription-quantitative polymerase chain reaction; GAPDH, glyceraldehyde-3-phosphate dehydrogenase; KD TAZ, knockdown of transcriptional co-activator with PDZ-binding motif; KO TAZ, knockout of transcriptional co-activator with PDZ-binding motif.
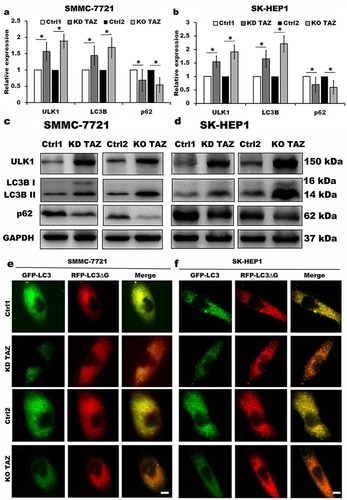
Figure 5 TAZ knockdown and knockout reduced the migratory and invasive ability of SMMC-7721 and SK-HEP1 cells through autophagy induction.
Notes: (A and B) Migration and invasion of stable TAZ knockdown (A) and knockout (B) SMMC-7721 and SK-HEP1 cells and their corresponding control cells in the presence or absence of 10 mM 3-MA or 30 μM CQ were determined by Transwell assays. Representative images of three independent experiments are shown. Scale bar =50 μm. (C and D) Quantification of relative numbers of migrated and invaded cells in five randomly fields for each replicate was shown. All experiments were performed independently three times and data were shown as mean±SD. P-values were obtained from Student’s t test. *P<0.05.
Abbreviations: TAZ, transcriptional co-activator with PDZ-binding motif; 3-MA, 3-methyladenine; CQ, chloroquine; KD TAZ, knockdown of transcriptional co-activator with PDZ-binding motif; KO TAZ, knockout of transcriptional co-activator with PDZ-binding motif.
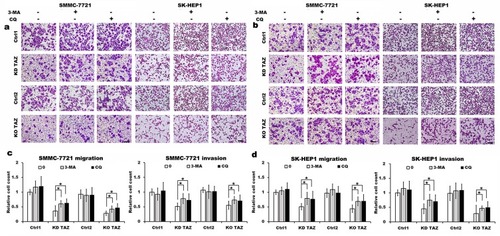
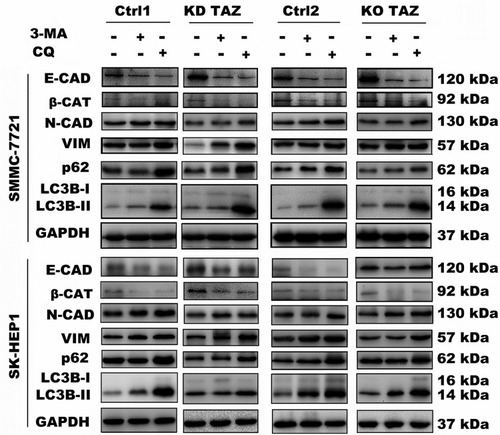
Figure 6 Effect of autophagy inhibition on the expression of the indicated genes in stable TAZ knockdown and knockout SMMC-7721 and SK-HEP1 cells.
Notes: The indicated proteins in cellular extracts were determined by Western blot from SMMC-7721 and SK-HEP1 cells in the presence or absence of 3-MA (10 mM) or CQ (30 μM). GAPDH was used as a loading control. Representative blots are shown (n=3).
Abbreviations: EMT, epithelial-mesenchymal transition; TAZ, transcriptional co-activator with PDZ-binding motif; 3-MA, 3-methyladenine; CQ, chloroquine; GAPDH, glyceraldehyde-3-phosphate dehydrogenase; E-CAD, E-cadherin; β-CAT, β-catenin; VIM, Vimentin; N-CAD, N-cadherin; KD TAZ, knockdown of transcriptional co-activator with PDZ-binding motif; KO TAZ, knockout of transcriptional co-activator with PDZ-binding motif; LC3B, microtubule-associated protein 1 light chain 3 beta.