Figures & data
Figure 1 The expression of CCDC132 in GC. (A) The top amplification frequency of CCDC132 gene in various cancers. (B) Quantitative RT-PCR for the CCDC132 mRNA expression in the four GC cell lines and normal gastric epithelial cell line, GAPDH was loaded as the housekeeping gene. (C) Parent AGS cells and MGC-803 cells were infected by scramble-shRNA (NC) and CCDC132-shRNA (KD) expressing lentiviruses, respectively; then, quantitative RT-PCR was performed to detect the knockdown efficiency of CCDC132, GAPDH was loaded as the housekeeping gene. (D) The knockdown efficiency of CCDC132 of AGS cells was further confirmed by Western blot, GAPDH served as the loading control. Results are presented as the mean ± SD. ***p<0.001.
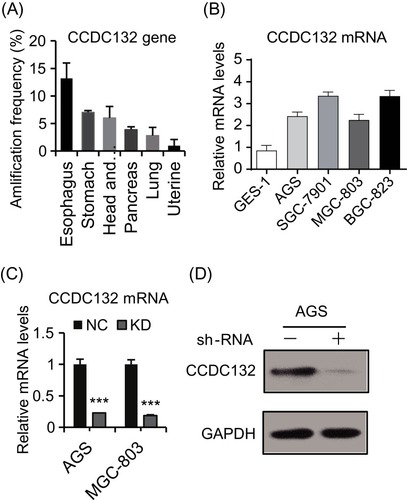
Figure 2 CCDC132 is essential for GC cell proliferation and survival. (A) and (C) the scramble (NC) and CCDC132-shRNA (KD)-expressing lentiviruses were also simultaneously expressing green fluorescent protein (GFP); these cells were seeded and then captured the fluorescent signal every day; (B) and (D) then the cell number was autocalculated by manipulating those fluorescent signals in Celigo® Image Cytometer and its software. (E) and (F) Colony formation analysis for the indicated cells. (G) Quantification of colony formation from (E) and (F). (H) FACS-based apoptosis analysis for the indicated cells. (I) Quantification of apoptosis ratio from (H). Results are presented as the mean ± SD. **p < 0.01; ***p < 0.001.
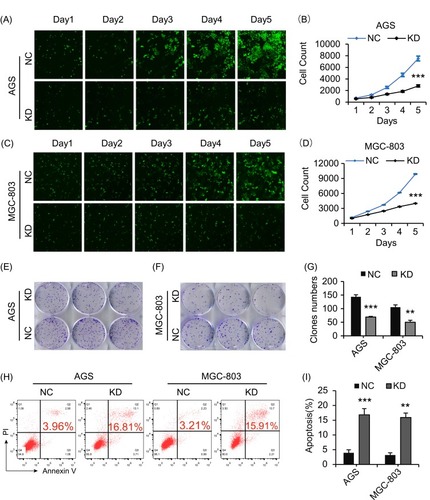
Figure 3 Knockdown of CCDC132 led to activate the pro-apoptotic signals in MGC-803 cells. (A) The PathScan® Stress and Apoptosis Signaling Antibody Array Kit was applied to detect the signaling molecules of stress response and apoptosis that responded to knockdown of CCDC132 in MGC-803 cells, and the interest candidates were present as described above. (B) Quantitative the array data by array analysis software. Results are presented as the mean ± SD. (C) Cell proliferation pathway proteins were confirmed by Western blot in knockdown CCDC132MGC-803 cells, JNK, AKT and ERK served as the loading control. (D) The apoptosis relative proteins were confirmed by Western blot in knockdown CCDC132 MGC-803 cells, GAPDH served as the loading control. (E) The DNA damage marks were detected by western bolt in knockdown CCDC132 MGC-803cells, GAPDH served as the loading control. (F) Cell proliferation pathway proteins were confirmed by Western blot in knockdown CCDC132MGC-803 cells, JNK, AKT and ERK served as the loading control. (G) The apoptosis relative proteins were confirmed by Western blot in knockdown CCDC132 MGC-803 cells, GAPDH served as the loading control. (H) The DNA damage marks were detected by western bolt in knockdown CCDC132 MGC-803cells, GAPDH served as the loading control. *p < 0.05; **p < 0.01; ***p < 0.001.
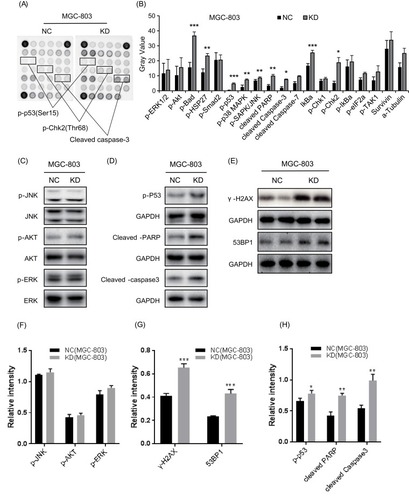
Figure 4 CCDC132 plays an important role in tumorigenesis and tumor growth of MGC-803 cells. (A) Xenografts from NC-MGC-803 cells and KD-MGC-803 cells were present at the ending point. (B) The tumor growth curves of xenografts from NC-MGC-803 cells and KD-MGC-803 cells, respectively. (C) Xenografts from NC-MGC-803 cells and KD-MGC-803 cells were weighted at the ending point. (D) Fluorescent intensity of the xenograft model 3 weeks after inoculation. (E) Quantitative analysis shows that of the fluorescent intensity of the KD group was obviously lower than that of the NC group. Results are presented as the mean ± SD. *p<0.05; **p<0.01.
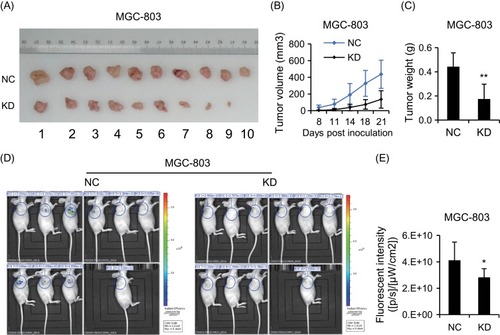
Table 1 The Associations Of CCDC132 Expression With Clinicopathological Features In Patients With Resectable GC.
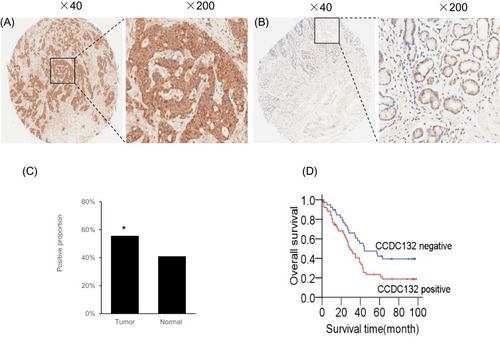
Figure 5 CCDC132 confers poor prognosis in patients with GC. (A) Representative Immunohistochemical staining for CCDC132 in cancer tissues. (B) Representative Immunohistochemical staining for CCDC132 in adjacent normal tissues. (C) Frequency of CCDC132 expression in cancer and adjacent normal tissues (n=90), (D) Kaplan–Meier curves of the overall survival of patients negative or positive for CCDC132 expression (log rank = 5.240, p=0.022). *p < 0.05.