
Figures & data
Table 1 Patient characteristics
Table 2 Response rate of gemcitabine-containing regimens
Figure 1 Kaplan–Meier curve of the PFS rate in the antibiotics-untreated group and antibiotics-treated group.
Abbreviation: PFS, progression-free survival.
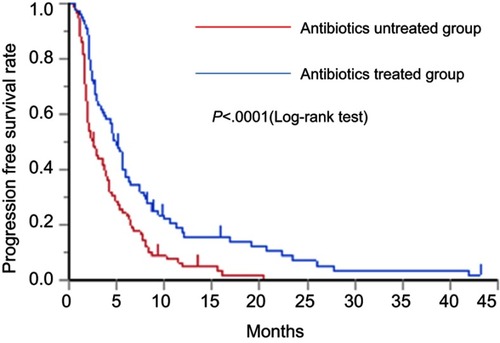
Figure 2 Kaplan–Meier curve of the OS rate with the antibiotics-untreated group and antibiotics-treated group.
Abbreviation: OS, overall survival
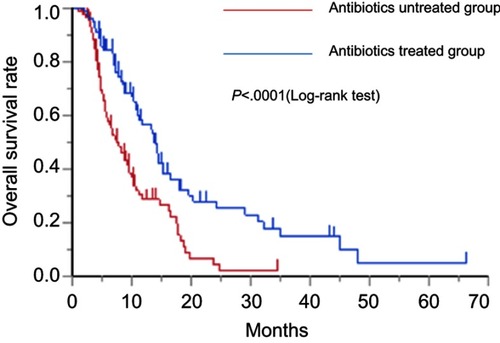
Table 3 Severe (grade 3 or 4) toxicities by gemcitabine-containing regimens
Table 4 Univariate and multivariate analyses for the relationship between the response to the gemcitabine-containing regimens and patients’ background or toxicity by gemcitabine-containing regimens
Table S1 The median progression free survival time (PFS) or the median OS of the patients with biliary tract cancer, pancreatic cancer, sarcoma and other cancers in antibiotics-untreated group and antibiotics-treated group
Table S2 Patient’s original data in the present study