Figures & data
Table 1 Univariate analysis of factors affecting recurrence-free survival
Table 2 Multivariate analysis of all significant factors affecting recurrence-free survival
Table 3 Comparison of clinicopathological and demographic features of patients based on transplantation type
Figure 1 Kaplan–Meier survival curves in patients according to the type of living donor liver transplantation. (A) Recurrence-free survival (p=0.002). (B) Overall survival (p=0.326).
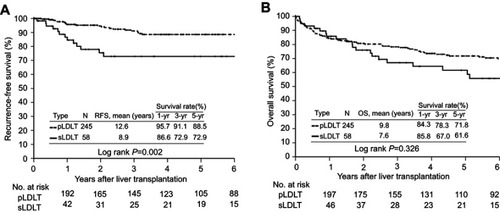
Table 4 Univariate and multivariate analyses of pretransplantation factors affecting HCC recurrence of patients after salvage living donor liver transplantation (n=58)
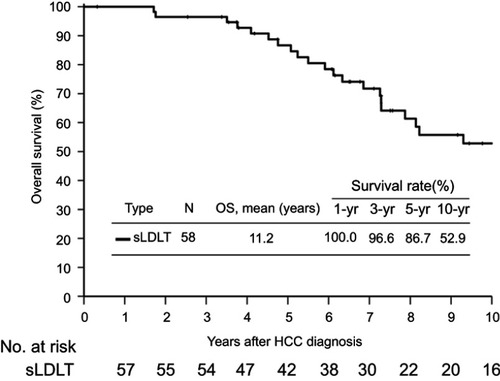
Figure 2 The cumulative overall survival was calculated from the time of initial hepatocellular carcinoma diagnosis in patients who underwent salvage living donor liver transplantation.