Figures & data
Table 1 Characteristics of FL patients
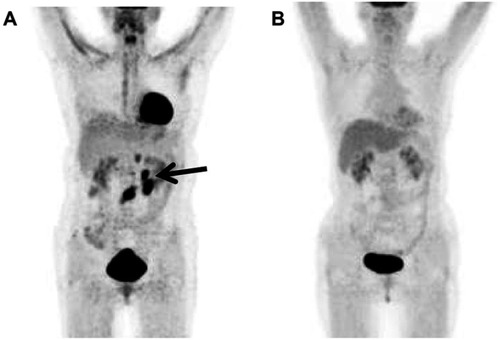
Figure 1 The baseline 18F-FDG PET/CT (A) image showed hypermetabolic lesions with TLG of 2,366.61. I-PET (B) after four cycles of R-CHOP therapy, and E-PET (C) after end-of therapy showed no hyper-metabolic lesions. After 11 months of therapy, the patient experienced relapse. 18F-FDG PET/CT (D) showed increased 18F-FDG uptake in the liver, abdomen and right pelvic (arrows).
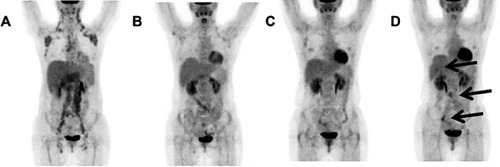
Figure 2 The baseline PET/CT (A) image showed hypermetabolic lesion in the left cervical lymph node (arrows) with a TLG of 65. E-PET (B) after end-of therapy did not show hypermetabolic lesions and no recurrence after the 49-month follow-up.
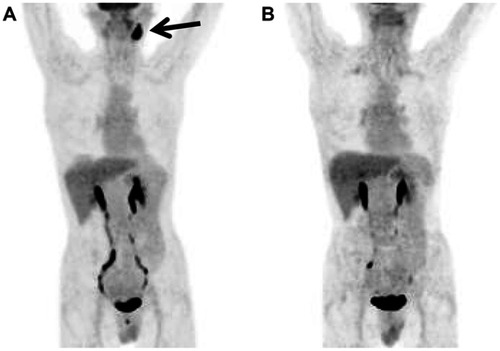
Table 2 Comparison between low and high tMTV, TLG and SUVmax groups
Table 3 Correlation between clinical characteristics with semi-quantitative parameters
Table 4 Baseline 18F-FDG PET/CT metabolic parameters
Figure 3 Kaplan-Meier survival curves for the PFS (A, C, E) and OS (B, D, F) The baseline tMTV and TLG results were associated with PFS (A, C) and OS (B, D), and the baseline SUVmax result was associated with PFS (E), but not OS (F).
Table 5 Univariate analysis for survivals
Table 6 Multivariate analysis for survivals
Table 7 Comparison of PFS between positive and negative groups using D-5PS and IHP criteria
Figure 4 Kaplan-Meier survival curves for the PFS of D-5PS criteria (A, B) and IHP criteria (C, D). The I-PET results according to D-5PS (A) and IHP criteria (C) were not associated with PFS; and the E-PET results according to D-5PS (B) and IHP criteria (D) were associated with PFS.
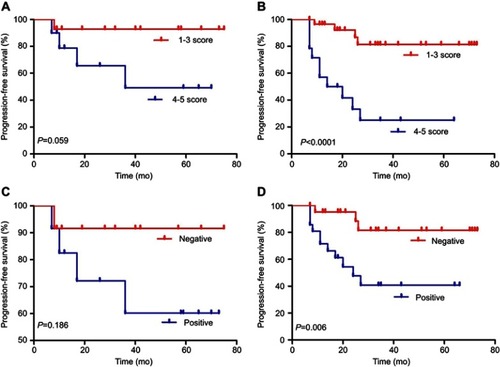
Figure 5 A patient with interim18F-FDG PET/CT showed increased 18F-FDG uptake in the neck, axilla, mediastinum, abdominal and pelvis. D-5PS and IHP criteria were considered positive for patient, and the patient experienced relapse after 7 months of follow-up. A patient with an interim18F-FDG PET/CT D-5PS (score 1) and negative IHP criteria did not show progression and survived at the end of the 28-month follow-up period (B).
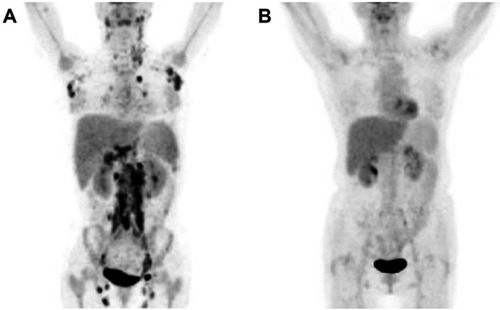
Table 8 Predictive values of interim and end-of treatment PET/CT
Figure 6 Kaplan-Meier survival curves for the PFS of ΔSUVmax%. The I-PET results according to ΔSUVmax% (A) were not associated with PFS; and the E-PET results according to ΔSUVmax% (B) were associated with PFS.
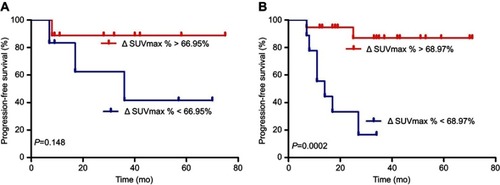
Figure 7 A patient with end-of therapy 18F-FDG PET/CT showed increased 18F-FDG uptake in the abdomen (arrows). D-5PS and IHP criteria were considered positive for patient, and the patient experienced relapse after 7 months of follow-up (A). A patient with an end-of therapy 18F-FDG PET/CT D-5PS (score 1) and negative IHP criteria did not show progression and survived at the end of the 71-month follow-up period (B).