Figures & data
Figure 1 MCL impact on the HCC growth in vivo and in vitro. (A) Huh7 cells treated with the indicated dose of MCL were analyzed for proliferation using the CCK8 assay from 24 hr to 72 hr. n = 3. Values represent means ± standard deviation (s.d.). Repeated measures ANOVA, followed by Bonferroni post-tests. p<0.001. (B) Several liver cancer cells such as Huh7, HepG2, QGY-7703, Bel-7404, Hep3B, and PLC/PRF/5 treated with 30 µM MCL were analyzed for proliferation using the CCK8 assay at 24 hr. (C) Colony formation assay in Huh7 cells treated with the indicated dose of MCL. Representative images showed colonies stained with crystal violet. The number of colonies in each well was counted. n= 3. Values represent the mean ± s.d. ANOVA. p<0.01 (D) Trans-well assay in Huh7 cells treated with the indicated dose of MCL. Representative images showed colonies stained with crystal violet. The number of cells in each well was counted. n= 3. Values represent the mean ± s.d. ANOVA. p<0.001. (E, F) Measurement size (E) and weight (F) of tumors formed from Huh7 cells injected in NUDE mice. Huh7 cells were injected into NUDE mice. When tumors were grown to 1 cm3, MCL was injected daily for the indicated number of days. Individual tumor volumes were measured every day. Repeated measures ANOVA, followed by Bonferroni post-tests. At the end of the MCL treatment, all tumors were weighed and photographed. Mann–Whitney test. *p<0.05. **p< 0.01.
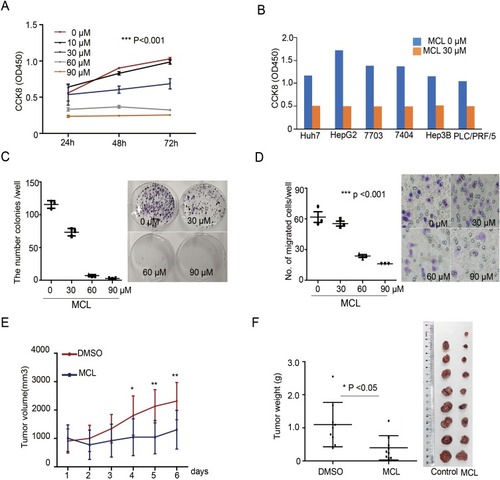
Figure 2 MCL impact on the HCC stemness. (A) Tumor sphere assay in suspension culture. By counting the number of spheroids in the condition of either 30 µM MCL treatment or DMSO only (0 µM), spheroid formation ability was evaluated. n= 3. Values represent the mean ± s.d. Unpaired t-test. p< 0.001. (B) FACS analysis for liver cancer cell stemness markers. Cells highly expressing liver cancer cell stemness markers such as CD44, EpCAM, and CD133 were analyzed in the condition of either 30 µM MCL treatment or DMSO only.
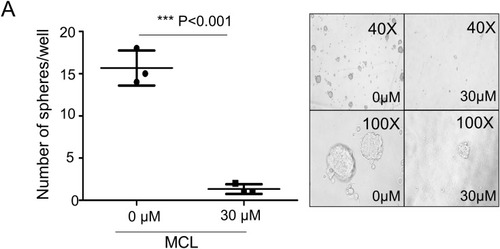
Figure 2 (Continued).
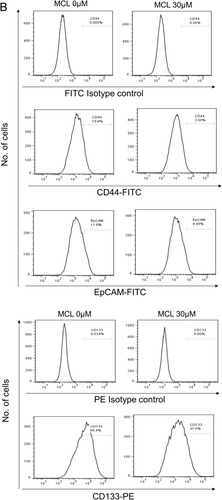
Figure 3 Impairment of both the F-actin cytoskeleton and mitochondria is an earlier event than apoptosis in the liver cancer cells treated with MCL. (A) Huh7 cells treated with 30 µM MCL for the indicated time were analyzed for apoptosis using FACS with Annexin V assay. (B) Huh7 cells treated with 30 µM MCL for the indicated time were analyzed for mitochondrial ROS using FACS with mitochondrial ROS indicator, mitoSox. (C) Huh7 cells treated with 30 µM MCL for the indicated time were analyzed for the structure of both cytoskeleton and mitochondria under fluoromicroscope. The arrows indicated the destructuring F-actin fibers. Phalloidin and MitoTracker Green FM were used for the staining of the actin cytoskeleton and the mitochondria, respectively.
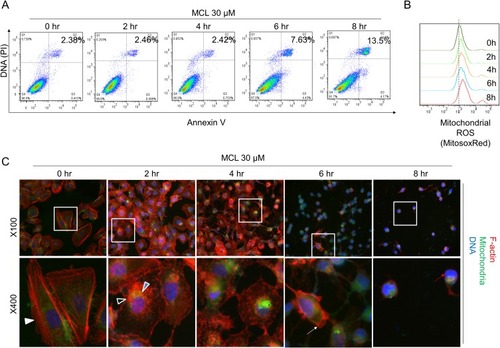
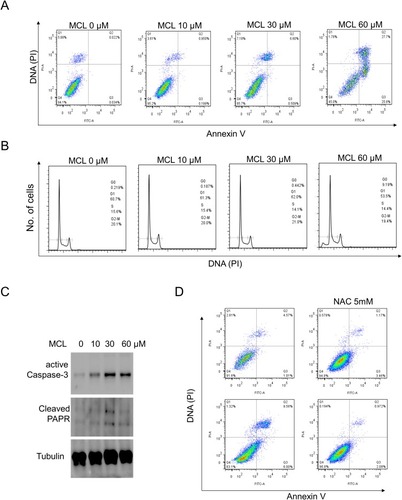
Figure 4 MCL is more effective for apoptosis in liver cancer cells than the cell cycle. (A) Huh7 cells treated with the indicated doses of MCL were analyzed for apoptosis using FACS with Annexin V assay. (B) Huh7 cells treated with the indicated doses of MCL were analyzed for cell cycle using FACS with PI staining. (C) Huh7 cells treated with the indicated doses of MCL were analyzed for the level of apoptosis markers such as caspase and PARP using Western blotting with anti-active caspase 3 and anti-PARP, respectively. Tubulin was used as an internal control. (D) The impact of ROS on the MCL-triggered apoptosis in liver cancer cells was evaluated by Annexin V assay using a ROS scavenger, NAC. NAC was pre-treated to Huh7 cells before MCL treatedment.