Figures & data
Table 1 Demographic And Clinicopathological Characters Of NM Patients
Figure 1 The initial workup for NM. The patients suspected with NM should be evaluated according to the neurological examination and MRI scans, and then the confirmed NM cases would be included in the NM database and receive the corresponding treatment and follow-up.
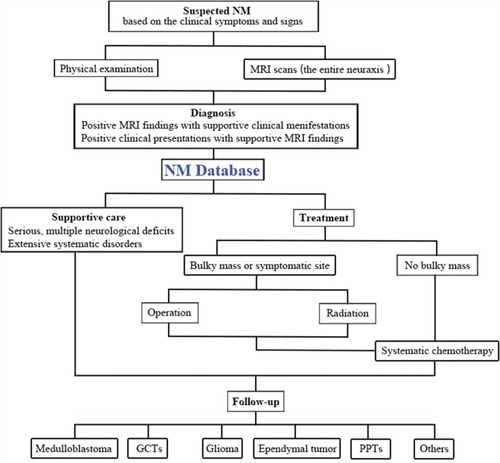
Figure 2 Epidemiological distribution in this cohort of cases. (A) The incidence of NM scaled by gender distributed in seven age groups from < 10 years to > 60 years. (B) The mortality cases of NM divided into seven age groups from < 10 years to > 60 years. The incidence of metastatic lesions presented in different cranial (C, left) and spine (D, right) sites. (E) The interval from primary tumor removal to NM onset.
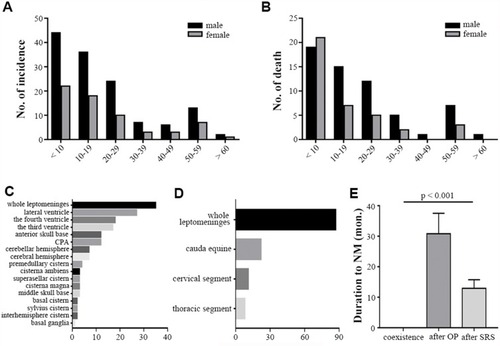
Figure 3 Representative radiographic panel of NM classification. (A–D) The intracranial NM subtypes. (A) The sagittal T1WI with enhancement showing the disseminated medulloblastoma on the surface of leptomeninges as the filament pattern (red arrow). (B) The axial enhanced T1WI displaying the procumbent-shape metastatic glioma located at the internal walls of the lateral ventricle. (C) The sagittal contrasted T1WI showing lots of nodular metastases in the subarachnoid spaces which were less than 1 cm. (D) The axial T1WI with enhancement presenting the two massive round metastatic anaplastic ependymomas in the subarachnoid cisterns. (E–K) The intraspinal NM subtypes. € The sagittal whole spine MRI showing the LI subtype, the leptomeningeal linear enhancement with diffuse miliary medulloblastoma. (F) The sagittal T1WI with contrast exhibiting the metastatic medulloblastoma with extensive distribution in the cervical, thoracic and lumbar leptomeninges, classified as the LIIa subgroup. (G) The sagittal cervical MRI with enhancement showing the LIIb subtype, which was located in the procumbent pattern with a narrow base in the subarachnoid space of C5–C7 level. (H) The sagittal enhanced T1WI displaying the multiple nodular NM located in the cauda equine, classified as the NI subtype. (I) The sagittal T2WI showing the giant metastasis with irregular boundary filling the entire lumber and sacral canal, identified as the NIIa subtype. (J) The sagittal T2WI presenting the NIIb NM as the massive tumor with distinct borders in the sacral canal. (K) The sagittal T2WI showing some intramedullary metastases in the cervical and thoracic spinal cord.
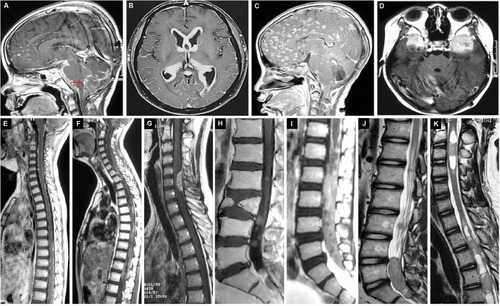
Figure 4 Representative neuroimages of two cases with NM receiving operations. (A, B) A 21-year-old woman suffering from the disseminated medulloblastoma with the massive subtype in the anterior skull base (A) received the gross total removal of NM (B). A 16-year-old boy with metastatic GCTs in the left ventricle (C) received the gross total resection of NM (D).
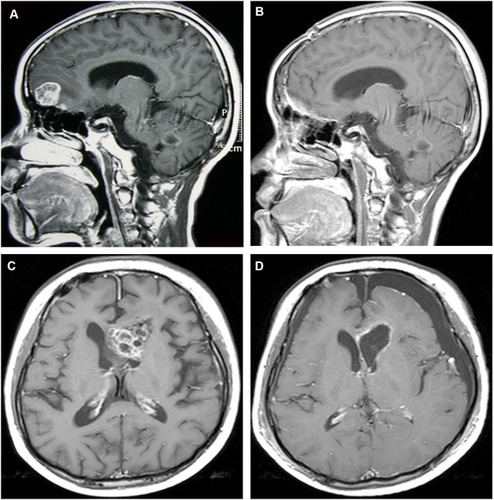
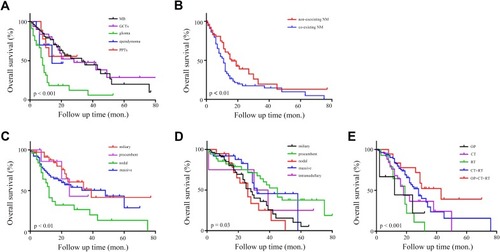
Figure 5 Survival analysis by Kaplan–Meier estimates. (A) The survival of patients with glioma was poorer than the other groups. (B) Patients without concurrent NM had a longer survival than the coexistence. (C) The survival of patients in the nodal intracranial group was shorter than that in the other groups. (D) The patients with intraspinal NM in the nodal subset showed the poor survival compared with other subgroups. (E) Patients receiving comprehensive treatment (OP + CT + RT) presented a better overall survival benefit than others.