Figures & data
Figure 1 Linc01278 is abnormally low expressed in PTC tissues and is associated with tumor burden of PTC.
Notes: (A) The boxplot of linc01278 expression level. Red and gray boxes represent thyroid carcinoma (THCA) tissue and normal thyroid tissue, respectively. The data came from the GEPIA database. (B) Linc01278 levels in PTC tissues and adjacent normal ovarian tissues (n=56) were evaluated via qRT-PCR. (C) Relative expression of linc01278 in T<1.5 cm group and T≥1.5 cm group. (D) Relative expression of linc01278 in non-metastasis group and lymph node metastasis group. (E) Relative expression of linc01278 in stage I+II group and stage III+IV group. (F) Linc01278 levels in PTC cell lines (BCPAP, K1, and TPC1) and normal human thyroid cell line (Nthy-ori3-1) were determined via qRT-PCR. *P<0.05, **P<0.01, ***P<0.001.
Abbreviation: THCA, thyroid carcinoma.
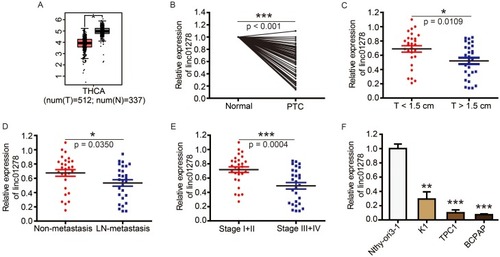
Figure 2 Linc01278 inhibits cell proliferation of PTC cells by inducing apoptosis.
Notes: (A) Linc01278 levels were evaluated via qRT-PCR. (B) The proliferation of TPC1 and BCPAP cells was determined via CCK8 assay. (C) The clonogenicity of TPC1 and BCPAP cells was detected by clony formation assay. The apoptosis of TPC1 and BCPAP cells was detected (D) and quantified (E) by flow cytometry. (F) The expression of apoptosis-related proteins was detected and quantified (G) by Western blot. *P<0.05, **P<0.01, ***P<0.001.
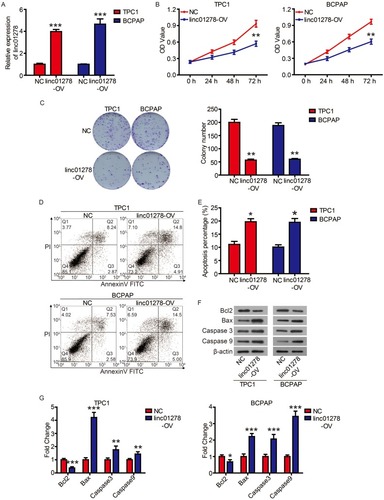
Figure 3 Linc01278 attenuates migration and invasion abilities of PTC cells by regulating EMT process.
Notes: The migration and invasion of TPC1 and BCPAP cells were determined (A) and quantified (C and D) by transwell assay. The migration of TPC1 and BCPAP cells were determined (B) and quantified (E) by wound healing assay. The expression of EMT-related proteins was detected (F) and quantified (G-H) by Western blot. *P<0.05, **P<0.01, ***P<0.001.
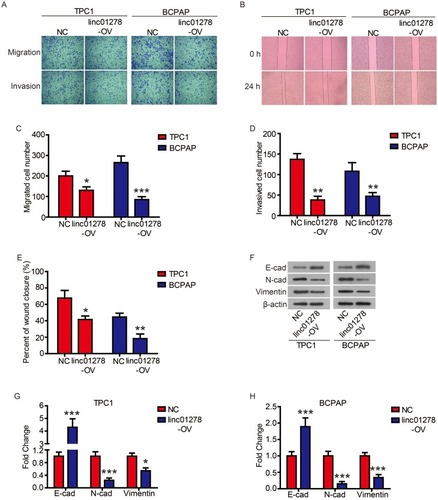
Figure 4 linc01278 functions as a ceRNA by sponging miR-376c-3p.
Notes: (A) The sequences of miR-376c-3p, wide type of linc01278 (WT) and mutated linc01278 (Mut). (B) The expression levels of luciferase of BCPAP cells transfected with wild-type (WT) or mutated (Mut) linc0127 reporters plus miR-376c-3p mimic or miR-NC were determined. (C) MiR-376c-3p levels in PTC tissues and adjacent normal ovarian tissues (n=56) were evaluated via qRT-PCR. (D) Correlation analysis between linc01278 and miR-376c-3p. ***P<0.001.
Abbreviations: WT, wild-type; Mut, mutated.
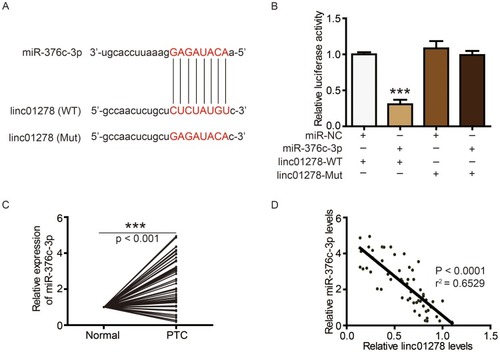
Figure 5 DNM3 is a target of miR-376c-3p in PTC.
Notes: (A) MiR-376c-3p levels in PTC cell lines (BCPAP, K1, and TPC1) and normal human thyroid cell line (Nthy-ori3-1) were determined via qRT-PCR. (B) The sequences of miR-376c-3p, wide type of DNM3 (WT) and mutated DNM3 (Mut). (C) The expression levels of luciferase of BCPAP cells transfected with wild-type (WT) or mutated (Mut) DNM3 reporters plus miR-376c-3p mimic or miR-NC were determined. (D) DNM3 levels in PTC tissues and adjacent normal ovarian tissues (n=56) were evaluated via Western blot. (E) Correlation analysis between DNM3 and miR-376c-3p. (F) Correlation analysis between DNM3 and linc01278. *P<0.05, ***P<0.001.
Abbreviations: WT, wild-type; Mut, mutated.
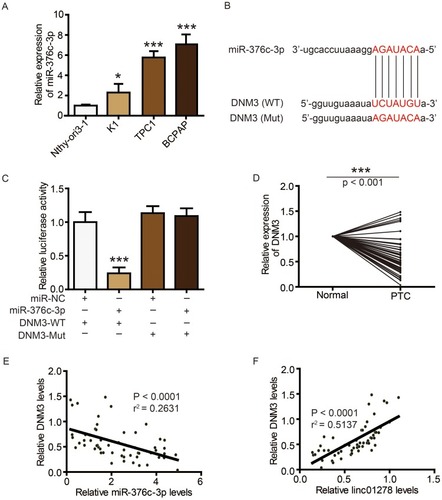
Figure 6 DNM3 is abnormally low expressed in PTC cell lines.
Notes: (A) DNM3 levels in PTC cell lines (K1, BCPAP, and TPC1) and normal human thyroid cell line (Nthy-ori3-1) were determined via Western blot. (B) DNM3 levels in TPC1 and BCPAP cells were determined via Western blot. **P<0.01, ***P<0.001.
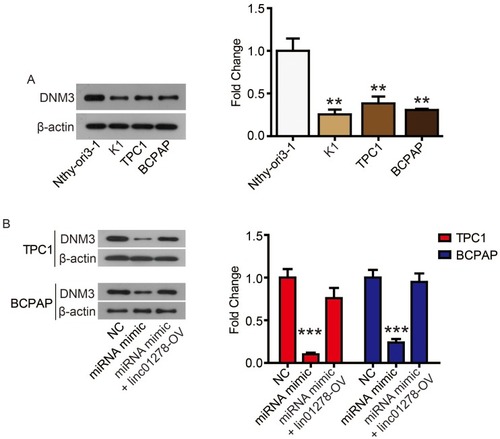
Figure 7 The promotion of miR-376c-3p on cell proliferation was attenuated by DNM3.
Notes: (A) DNM3 levels in TPC1 and BCPAP cells were determined via Western blot. (B) The proliferation of TPC1 and BCPAP cells was determined via CCK8 assay. (C) The clonogenicity of TPC1 and BCPAP cells was detected by clony formation assay. *P<0.05; **P<0.01.
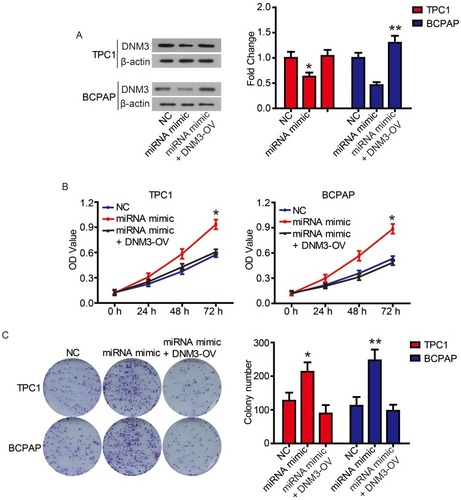
Figure 8 The inhibition of miR-376c-3p on apoptosis was attenuated by DNM3.
Notes: (A and B) The apoptosis of TPC1 and BCPAP cells was detected by flow cytometry. (C and D) The expression of apoptosis-related proteins was detected by Western blot. **P<0.01, ***P<0.001.
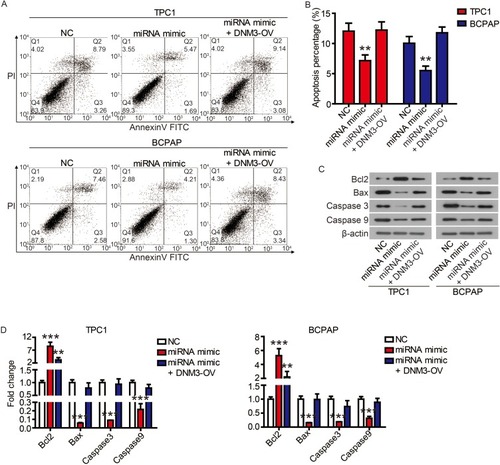
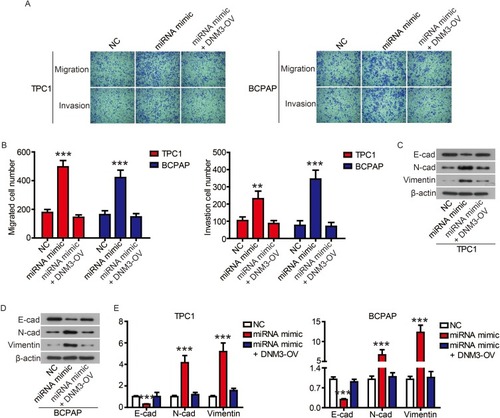
Figure 9 The promotion of miR-376c-3p on on cell migration and invasion was attenuated by DNM3.
Notes: The migration and invasion of TPC1 and BCPAP cells were determined (A) and quantified (B) by transwell assay. (C-E) The expression of EMT-related proteins was detected by Western blot. **P<0.01, ***P<0.001.