Figures & data
Figure 1 Flowchart of study patients and exclusion criteria.
Abbreviations: PDAC, pancreatic ductal adenocarcinoma; CT, computed tomography.
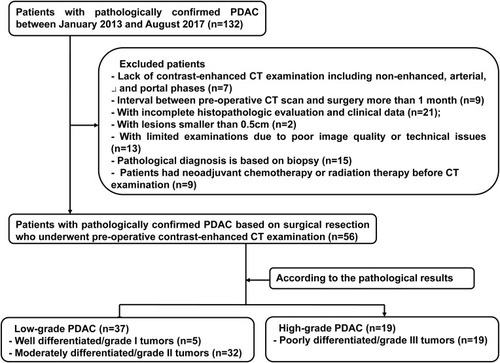
Figure 2 Analysis flowchart.
Abbreviations: PDAC, pancreatic ductal adenocarcinoma; CT, computed tomography; ROI, region of interest; SVM, support-vector machine.
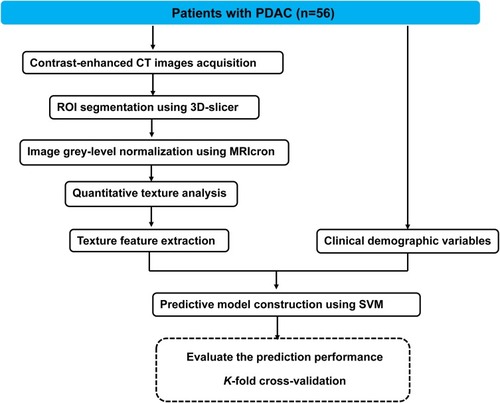
Table 1 Clinical And Biological Characteristics And CT Findings Of Low- And High-Grade PDAC Patients
Figure 3 (A) Axial portal-phase contrast-enhanced CT of low-grade PDAC in a 63-year-old woman. Red arrows indicate the tumor. (B) Tumor segmentation. One observer segmented tumor in red and the other observer segmented tumor in green. The lime region indicates the overlapping region of two lesion masks. Segmentation indicated by the dashed red line. (C) Image reconstructed by AW VolumeShare 5. (D) H&E-stained specimen (200×) demonstrated disordered, well-differentiated duct-like structure, tumor cells were cubic and columnar with small nucleoli and uncommon nuclear division.
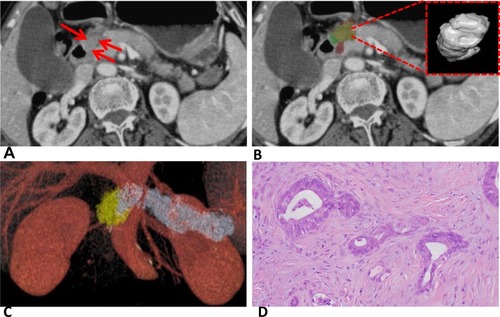
Figure 4 (A) Axial portal-phase contrast-enhanced CT image of high-grade PDAC in a 60-year-old man. Red arrows indicate the tumor. (B) Tumor segmentation. One observer segmented tumor in red and the other observer segmented tumor in green. The lime region indicates the overlapping region of two lesion masks. Segmentation shown by dashed red line. (C) Image reconstructed by AW VolumeShare 5. (D) HE-stained specimen (200×) demonstrated poor gland formation, tumor-cells nuclei were obviously pleomorphic with large nucleoli and common nuclear division.
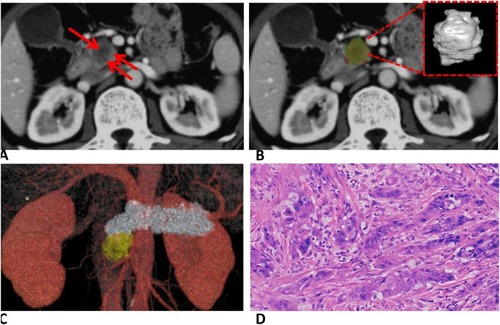
Table 2 Histogram Features, Run Length, And Co-Occurrence Features To Distinguish Low- And High-Grade PDAC
Figure 5 Box-and-whisker plots show the differences of nine histogram features between low-grade PDAC and high-grade PDAC. (A) Mean; (B) skewness; (C) fifth percentile; (D) tenth percentile; (E) 25th percentile; (F) 50th percentile; (G) 75th percentile; (H) 90th percentile; (I) 95th percentile.
Notes: Center line represents median. Lower and upper limits represent 25th and 75th percentiles, respectively. Observed values outside whiskers shown as dots.
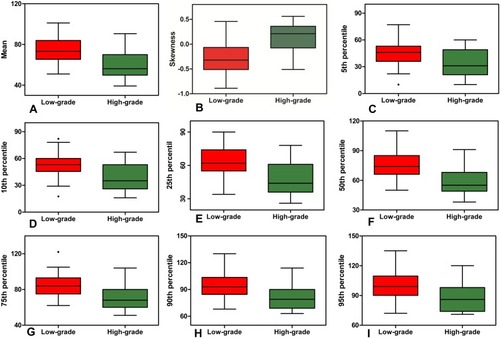
Figure 6 Box-and-whisker plots show the differences of seven run length features between low-grade PDAC and high-grade PDAC. (A) Gray-level nonuniformity; (B) run-length nonuniformity; (C) low gray-level run emphasis; (D) high gray-level run emphasis; (E) short-run low gray-level emphasis; (F) short-run high gray-level emphasis, (G) Long-run low gray-level emphasis.
Notes: Center line represents median. Lower and upper limits represent 25th and 75th percentiles, respectively. Observed values outside whiskers shown as dots.
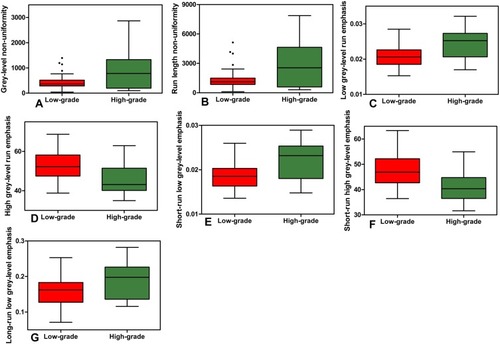
Figure 7 Box-and-whisker plots show differences in two co-occurrence features between low-grade PDAC and high-grade PDAC. (A) Cluster shade; (B) Haralick correlation..
Notes: Center line represents median. Lower and upper limits represent 25th and 75th percentiles, respectively. Observed value outside the whiskers are shown as dot.
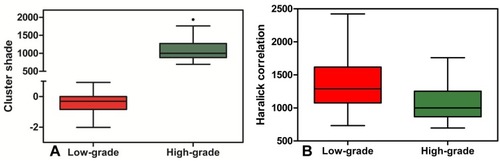
Table 3 SVM Models To Predict Postoperative Grade Of PDAC
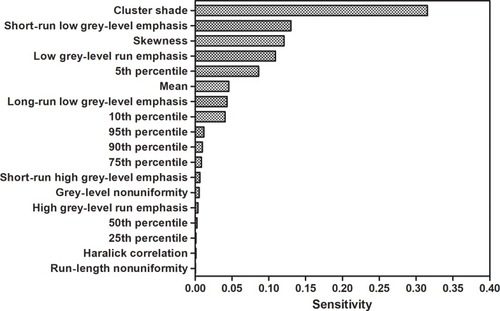
Figure 8 Ranking of features to predict low/high-grade PDAC according to importance in sensitivity analysis.