
Figures & data
Table 1 Patient Characteristics By PD-L1 Expression Levela And By TMB
Table 2 OS And PFS By PD-L1 Expression Levela
Figure 1 OS and PFS by PD-L1 expression level. (A) OS by PD-L1 expression ≥25% showing no significant association between PD-L1 expression level and OS (log-rank test, P=0.968). (B) PFS by PD-L1 expression ≥25% showing no significant association between PD-L1 expression level and PFS (log-rank test, P=0.714). (C) OS by PD-L1 expression ≥25% showing no significant association between PD-L1 expression level and OS for patients receiving second-line therapies (log-rank test, P=0.523). (D) OS from third-line therapy by PD-L1 expression ≥25% showing no significant association between PD-L1 expression level and OS for patients receiving third-line systemic therapies (log-rank test, P=0.607). X-axis is in years. The analyses are censored at 5 years.
Abbreviations: OS, overall survival; PD-L1, programmed cell death ligand-1; PFS, progression-free survival.
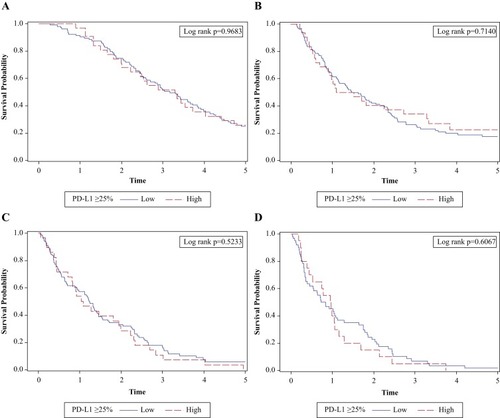
Figure 2 Mutational load vs PD-L1 expression level. (A) Scatter plot of log TMB and the percentage of tumor cells with PD-L1 expression demonstrating correlation between mutational load and % PD-L1 staining. PD-L1 expression, as a continuous covariate, was weakly but positively associated with the number of somatic mutations (Pearson’s correlation coefficient=0.22, P=0.05). (B) Correlation between mutational load and % PD-L1 staining in the TCGA demonstrating similar results as in Figure 2A. (C) Mutational load by high vs low PD-L1 expression level demonstrating no significant difference observed when TMB was analyzed by PD-L1 expression ≥25%.
Abbreviations: PD-L1, programmed cell death ligand-1; TCGA, The Cancer Genome Atlas; TMB, tumor mutational burden.
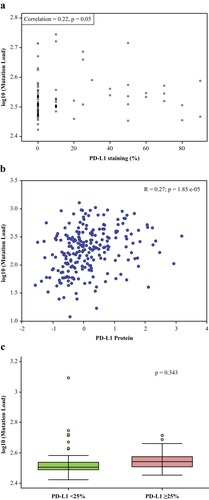
Table 3 High-Frequency Mutations And PD-L1 Expression
Data Availability
Data underlying the findings described in this manuscript may be obtained in accordance with AstraZeneca’s data sharing policy described at https://astrazenecagrouptrials.pharmacm.com/ST/Submission/Disclosure.