Figures & data
Table 1 Summary of genes and sequences of primers used for qRT-PCR
Table 2 Patient characteristics in included gene expression microarray studies
Figure 1 KRT7 and MUC1 transcriptional and translational programs are upregulated in metastatic sarcoma. (A) Genome-wide expression profiling in sarcoma via an oligonucleotide microarray revealed gene sets that are up- or downregulated ≥2 fold in metastatic relative to matched primary tumors. We noted several subgroups of related genes falling into various functional groupings such as cell adhesion and others listed. (B) Selection of KRT7 and MUC1 among the top 10 differentially regulated genes as they are the only two which are commonly co-expressed based on functional protein association networks. (C) Quantitative real-time PCR analysis of KRT7 and MUC1 levels in matched metastatic and primary sarcoma tumors from 30 patient samples presented as a ratio of metastatic/primary levels. The results shown are representative of two independent experiments. Formalin-fixed, paraffin-embedded samples from primary and metastatic sarcomas were stained for expression of KRT7 (D) and MUC1 (E) via immunohistochemistry. The results shown are representative of two independent experiments.
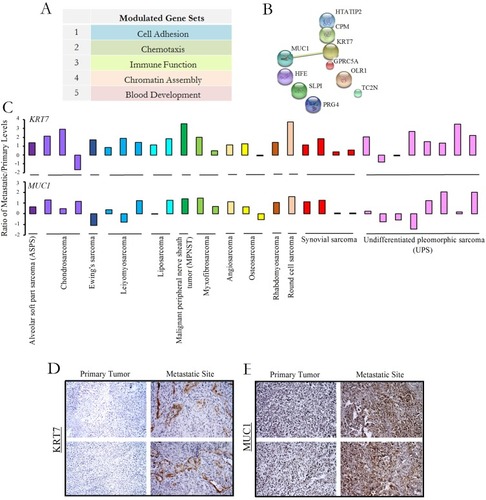
Table 3 Summary of 30 patients characterized across13 sarcoma sub-types used for quantitative real-time PCR
Figure 2 Overall survival and expression level. Kaplan–Meier curves for overall survival in patients with high versus low levels of expression of KRT7 (A) or MUC1 (B) in their metastatic lesions.
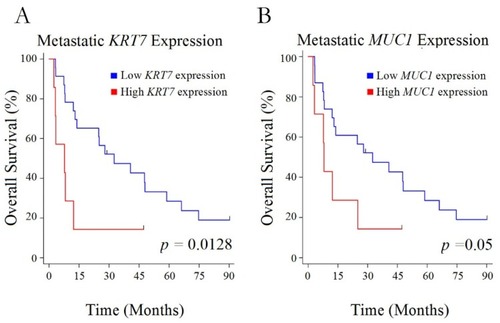
Figure 3 Recurrence after initial metastasectomy. (A) Disease-free survival after initial metastasectomy in patients with a high versus low interaction term for KRT7 and MUC1 expression in their resected metastatic sarcoma lesions. (B and C) Boxplots of relative gene expression of either KRT7 or MUC1 in the primary tumors of patients who either did (Yes) or did not (No) experience recurrence of their pulmonary metastasis after metastasectomy.
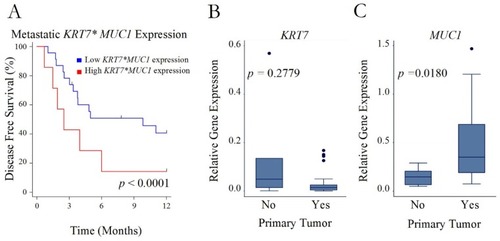
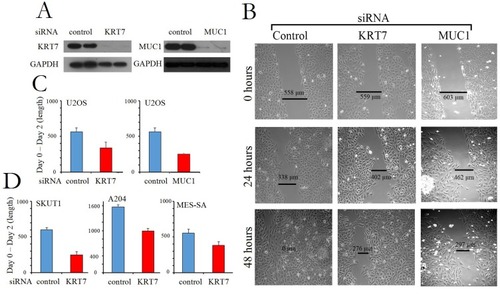
Figure 4 Gene knockdown of KRT7 and MUC1 blocks metastasis. (A) Western blot of U2OS sarcoma cell line subjected to gene knockdown using siRNA directed at KRT7 (Left panel) and MUC1 (Right panel). GAPDH was used as a loading control. (B) Cell migration/wound healing assay on U2OS osteosarcoma cells from (A) were analyzed at 0, 24, and 48 hrs (Left panel: control siRNA; Center panel: KRT7 siRNA; Right panel: MUC1 siRNA). Representative images from three independent experiments in osteosarcoma U2OS cells are presented and quantified in (C). (D) Relative cell migration/wound healing in several cell lines: leiomyosarcoma SKUT1 cells, rhabdoid tumor A204 cells, and uterine sarcoma MES-SA cells. The length at Day 2 is subtracted from the length at Day 0. The error bars represent standard deviation. Representative calculations from three independent experiments are presented.