Figures & data
Figure 1 Receiver operator characteristic curve analysis to predict overall survival for high-risk PTCs using the LMR in the pooled analysis. (A) The preoperative LMR can be used to predict overall survival (AUC=0.654, P=0.004); (B) the preoperative LMR=4.0 is the best cutoff to predict overall survival (AUC=0.637, P=0.010).
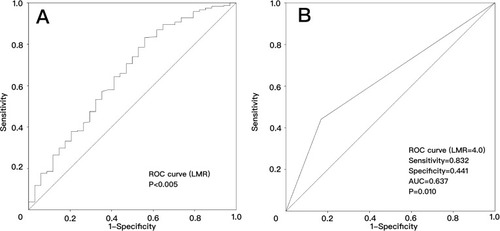
Table 1 Relationships between the preoperative LMR and clinical or tumor features in three sets of PTC patients with a high risk of recurrence. A lowser preoperative LMR correlated with a larger tumor size, advanced N stage and M stage, more multiple PTC cases, and more cases with the largest nodule larger than 3 cm in the 3 sets
Figure 2 Kaplan-Meier analysis of overall survival in high-risk PTCs according to the LMR in 3 independent sets. (A) Training set (P=0.049); (B) testing set (P=0.039); (C) validation set (P=0.029); (D) combined set (P<0.001).
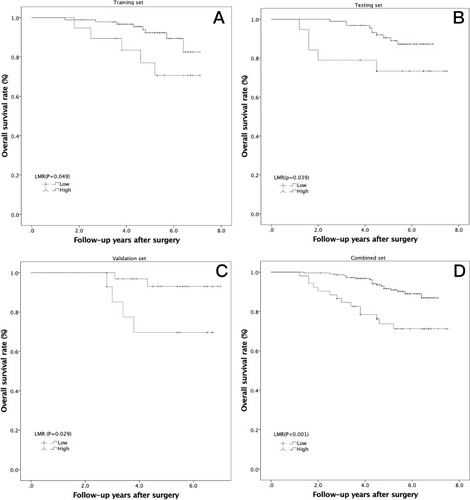
Figure 3 Kaplan-Meier analysis of PTC-free survival in high-risk PTCs according to the LMR in 3 independent sets. (A) Training set (P=0.042); (B) testing set (P=0.014); (C) validation set (P=0.045); (D) combined set (P<0.001).
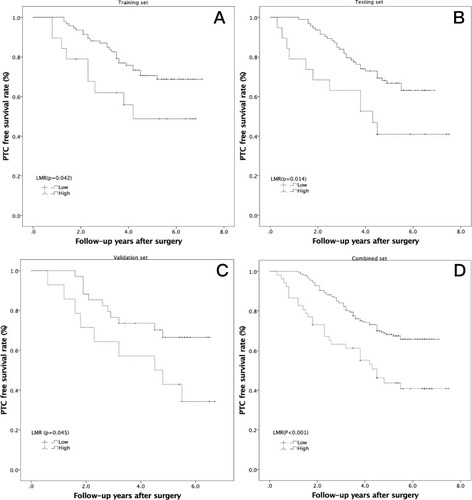
Table 2 Univariate Cox regression analyses of overall survival in three sets of high-risk PTC patients. The largest tumor size, total tumor size, distant metastasis, LNM number, and preoperative LMR in the training set were significant. In contrast, only distant metastasis and the preoperative LMR were risk factors for OS in the testing set, and the largest tumor size, total tumor size, distant metastasis, and preoperative LMR were significant in the validation set
Table 3 Multivariate Cox regression analyses of overall survival in the training, testing, validation, and combined sets. The largest tumor size, distant metastasis, and preoperative LMR were identified as independent prognostic factors associated with overall survival in the 3 sets and in the pooled analysis
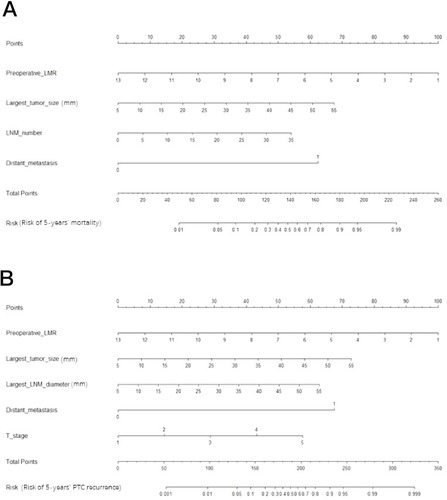
Figure 4 Nomogram for predicting high-risk PTC patient mortality (A) and PTC recurrence (B) for individual high-risk PTC patients. We can calculate the risk of early recurrence as follows. After obtaining the risk factor data, each risk factor can be used to calculate the number of points. Then, the points are added to obtain a total value. On the total-points axis, a line is drawn down to the risk axis. Then, the risk probabilities of mortality (A) and PTC recurrence (B) can be calculated for individual patients.